Key takeaways:
Japan's Consumer Price Index (CPI) increased by 2.3% year-on-year (YoY) in October, lower than the 2.5% rise observed in September and in line with market expectation of an increase of 2.3% YoY.
CPI excluding fresh food, the Bank of Japan's preferred measure, rose by 2.3% YoY in October, slightly higher than market expectations of a 2.2% YoY increase, and lower than September’s 2.4% increase.
Similarly, CPI excluding fresh food and energy rose by 2.3% YoY, slightly above the 2.1% YoY increase in September.
Japan's inflation diverges from patterns seen in other advanced economies. It is primarily driven by the goods sector, which rose 2.9% YoY in October (versus 3.5% YoY in September), rather than by the services sector, which saw a 1.5% YoY rise in October, higher than the 1.3% YoY recorded in September.
Inflationary pressures at the level of service inflation seem to be consolidating around 2% for service inflation less imputed rent, a welcome development for the BoJ.
The appreciation of the Yen (till mid-September) has helped in rebalancing the sources of inflation by lowering goods’ inflation. These inflationary developments along with the repricing of the interest rate path for the Federal Reserve would be consistent with an interest rate hike by the BoJ at its December meeting.
Related Posts
Japan September-24 Inflation Report (previous release)
Japan August-24 Inflation Report (previous release)
Japan July-24 Inflation Report (previous report);
The Bank of Japan's Put (related post);
Post-FOMC Update: The Fed and the Market Shifts (related post).
Review of the Inflation Release
In October 2024, consumer prices increased by 2.3% year-on-year (YoY), lower than the 2.5% year-on-year reported in September. On a month-to-month basis, prices increased by 0.6% MoM, compared to the 0.3%MoM decline in September.
In terms of core measures, the Bank of Japan tracks two main core inflation metrics (Chart 1): the Consumer Price Index (CPI) excluding fresh food and the CPI excluding both fresh food and energy.
The first measure, which excludes fresh food, increased by 2.3% year-on-year (YoY), slightly higher than market expectations of a 2.2% YoY rise and lower than the 2.4% YoY increase recorded in September. On a month-to-month (MoM) basis, it increased by 0.6%, reversing the 0.4% MoM decline seen in September.
The second core measure, excluding fresh food and energy, rose by 2.3% YoY, higher than the 2.1% YoY increase observed in September. On a month-to-month basis, the increase was 0.6%, much higher than the rise of 0.1% recorded in September.
Additionally, while the services sector is currently the main driver of inflation in many advanced economies Japan’s inflation is predominantly driven by the goods sector (Chart 2). In September, the Goods CPI increased by 2.9% year-on-year (YoY), lower than the 3.5% YoY in September, while the Services CPI rose by 1.5% YoY, higher than the 1.3% YoY increase recorded in September.
On a month-on-month basis, goods inflation increased by 0.8% MoM in contrast to the 0.1% MoM decline recorded in September. Similarly, service inflation increased by 0.4% MoM, reversing the 0.4% MoM decline seen in September.
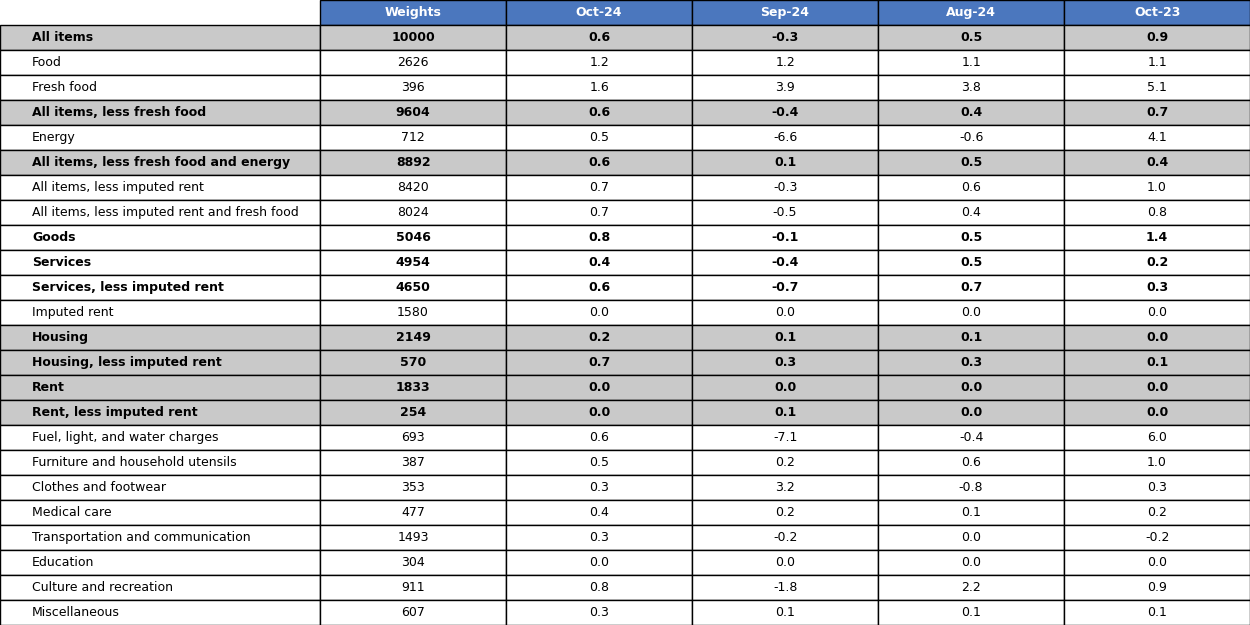
Further emphasizing Japan's unique position, the shelter component (“imputed rents”) of the CPI has increased by 0.2% year-on-year (YoY), slightly lower than September’s 0.3% rise. The “imputed rents" measure represents “the rent a person would have to pay to own and occupy a property” which constitutes the largest part of the CPI's housing component and weighs about 16% of the overall CPI. For a detailed breakdown of the housing and rent components in Japan, refer to Tables 1 and 2.
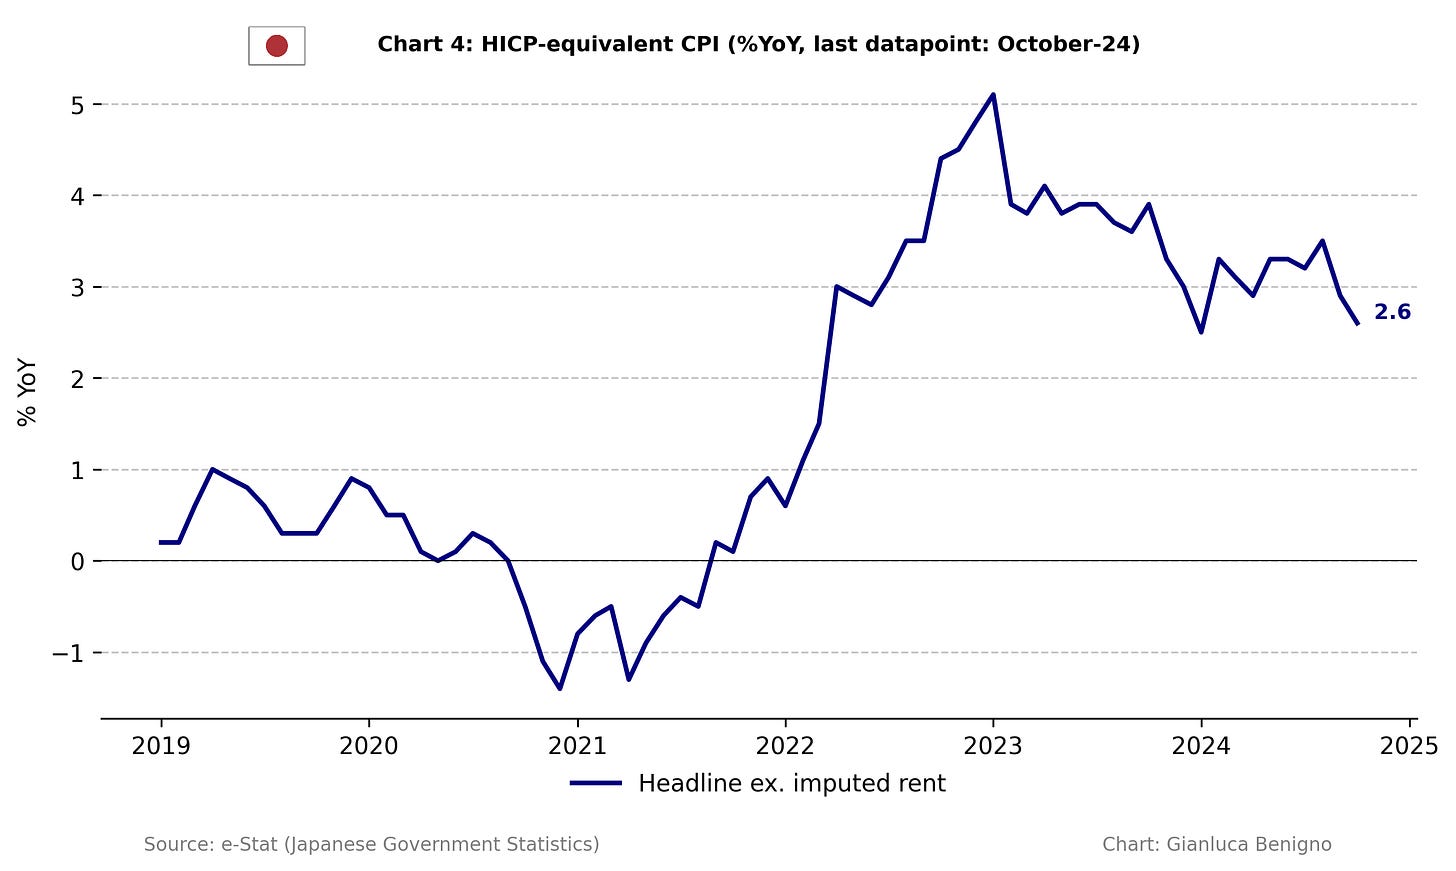
From this month onward, we provide a more detailed account of the different components of CPI inflation (see Tables 1 and 2). Moreover, we also report the CPI inflation less imputed rents (Chart 4). We refer to this measure as HICP-equivalent CPI. We have used this measure to allow for international comparison across countries. We note that in October HICP increased by 2.6% YoY, lower than the 2.9%YoY recorded in September suggesting an ongoing moderation of inflationary pressure. As can be seen from Chart 4, the peak of HICP inflation was reached at the beginning of 2023 with inflation just above 5%. In the pre-pandemic period, HICP inflation was fluctuation between 0 and 1% YoY.
Policy Implications
Inflation trends present mixed signals: headline inflation, CPI excluding food, and CPI excluding fresh food and energy are just above the 2% target. The encouraging development from the Bank of Japan perspective is the overall behavior of service inflation consistently above 1% (differently from the pre-pandemic period) and rising to 1.5%YoY in October. Goods inflation is lower than in previous months possibly consistent with the appreciation of the Yen during the summer. The high sensitivity of goods prices to exchange rate fluctuations could generate a further increase in goods inflation as we move towards the last quarter of 2024 as the Yen has partially reversed its gain since mid-September.
From a policy perspective, the Bank of Japan reaffirmed its commitment to a gradual approach to monetary policy normalization during the latest policy meeting. The current inflation reading is supportive of the removal of accommodation and monetary policy normalization. Considering the repricing of the U.S. interest rate path (higher for longer), it is likely that the BoJ could consider another interest rate hike at its December meeting.
Table 1: CPI by components (% YoY)
Source: e-Stat (Japanese Government Statistics)
Table 2: CPI by components (% MoM)
Source: e-Stat (Japanese Government Statistics)


