


November-24 U.S. CPI Inflation report
The Halt of Core Inflation will stall the Easing Cycle in 2025

Key takeaways:
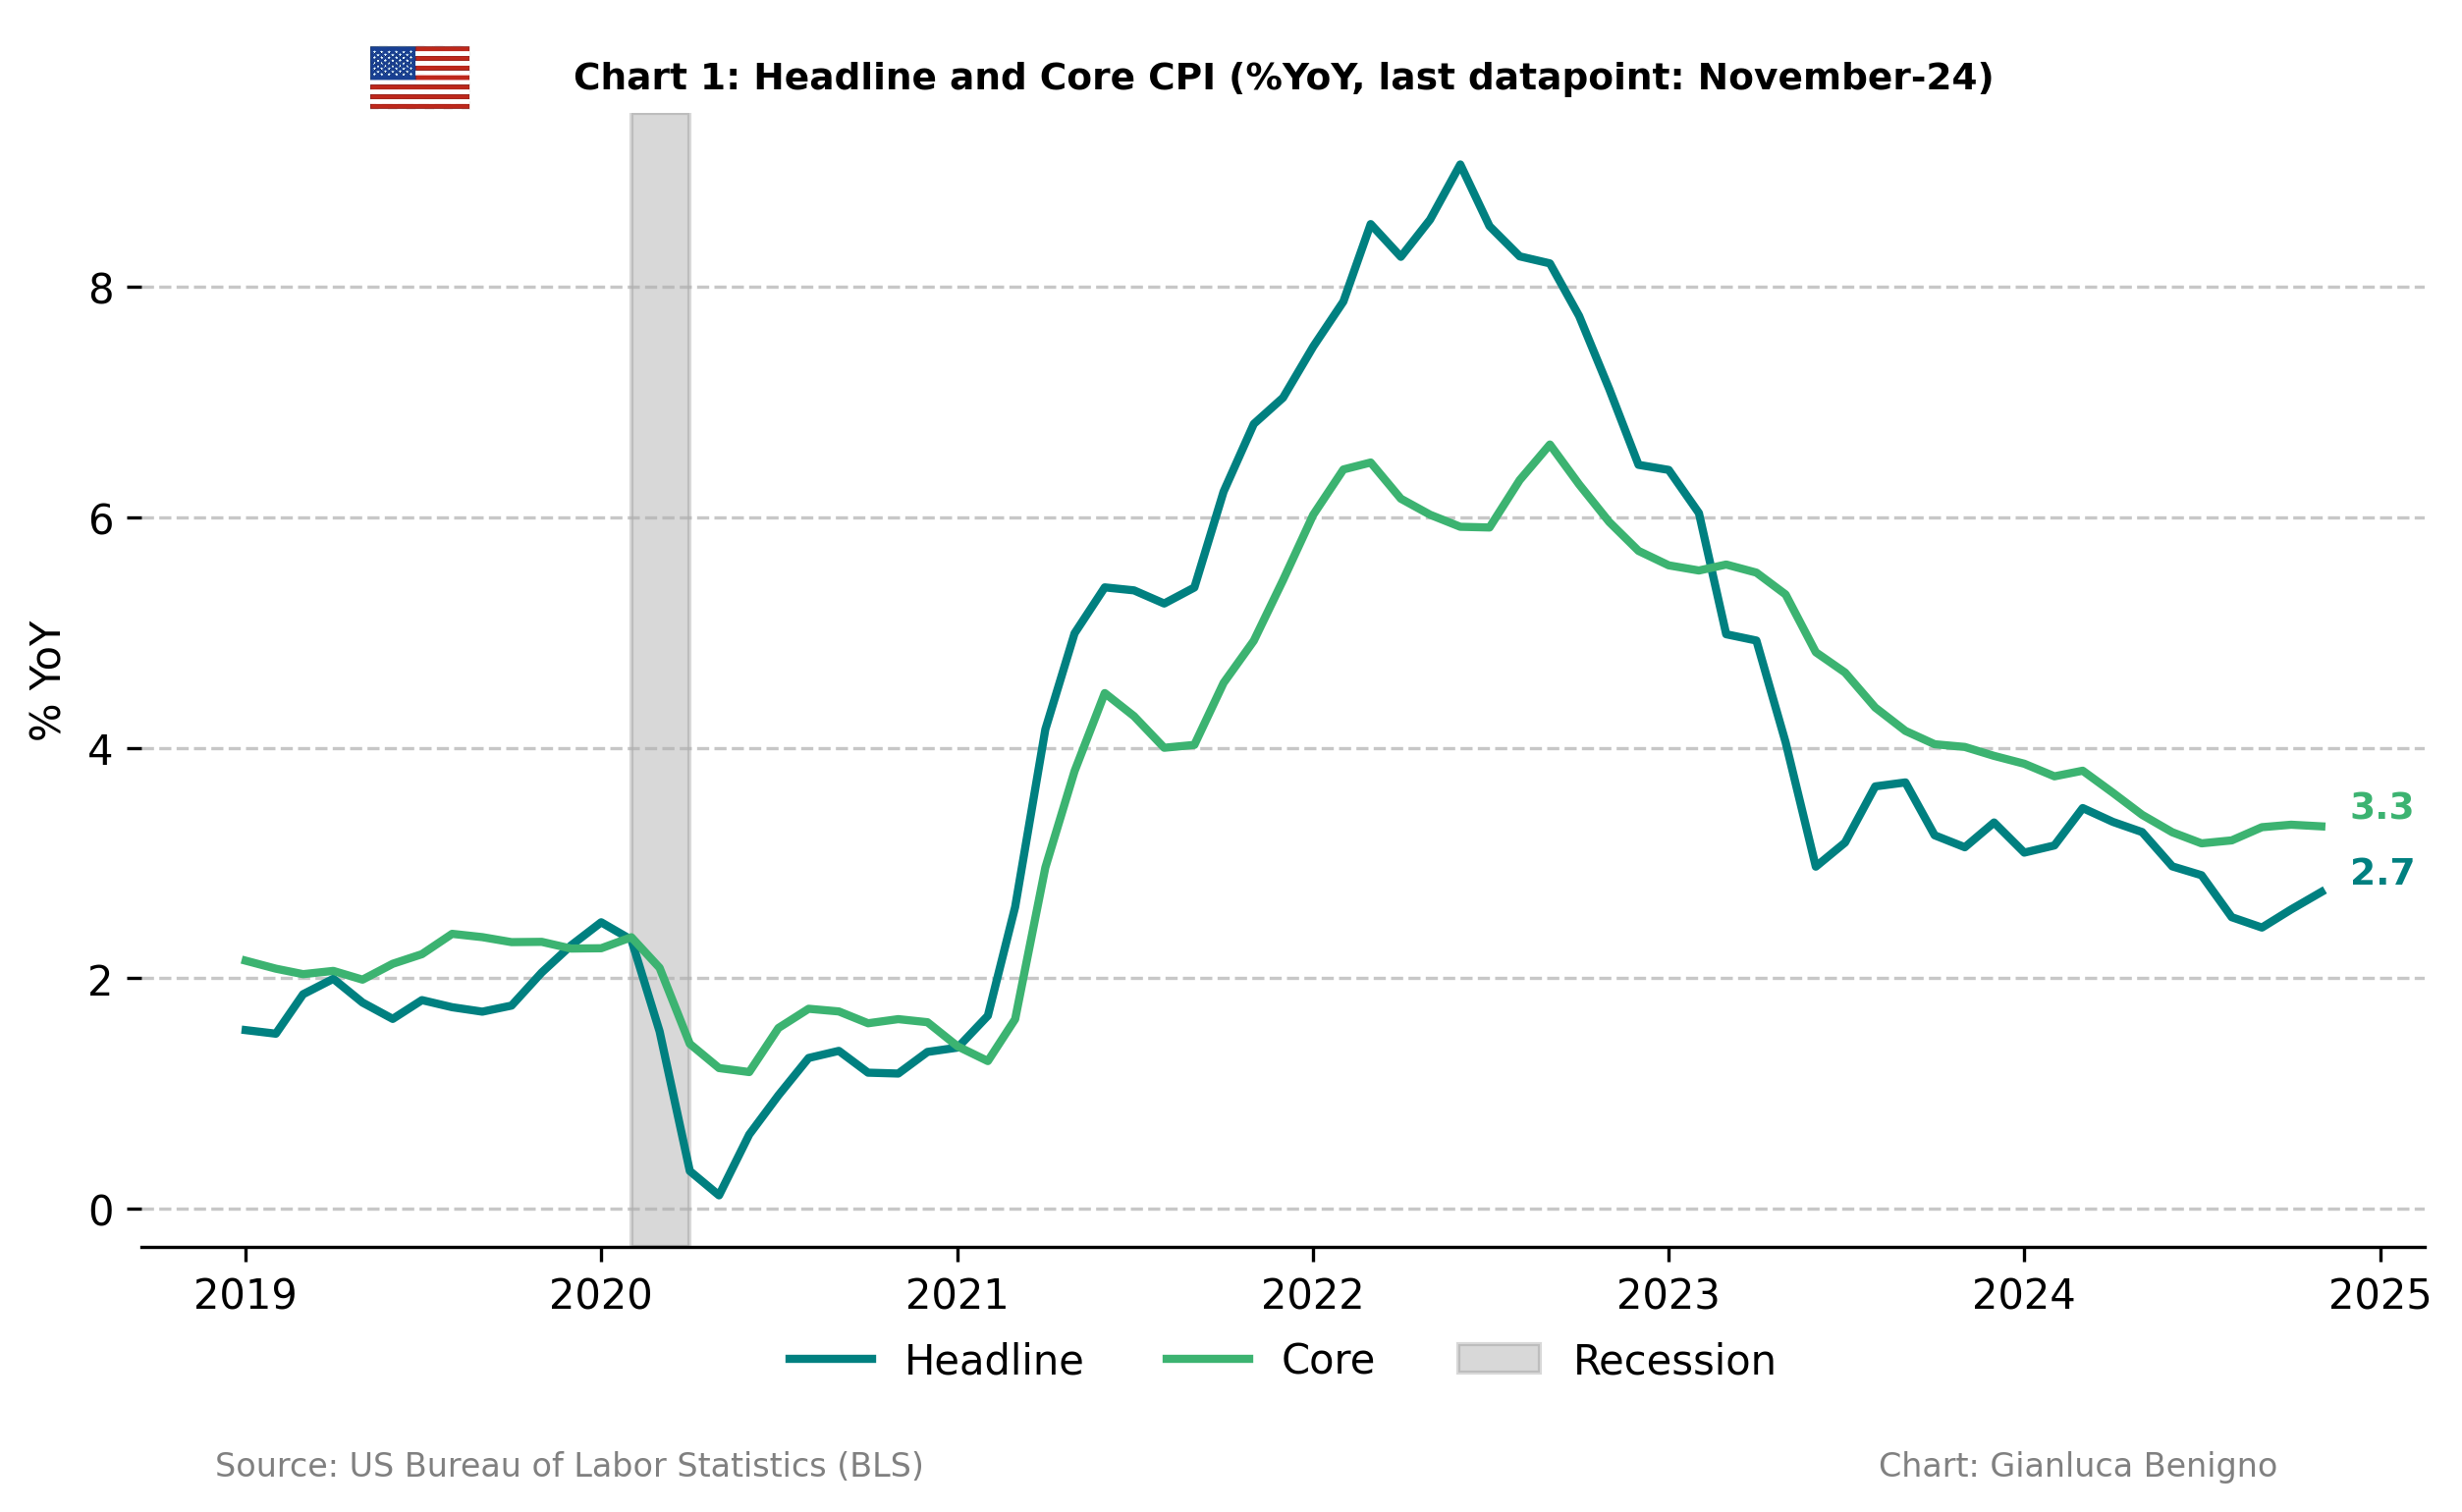
The overall Consumer Price Index (CPI, n.s.a.) increased by 2.7% year-on-year (YoY) (n.s.a) in November, in line with consensus expectation of 2.7% YoY and above the October reading of 2.6% YoY increase.
Core CPI in November was 3.3% YoY (n.s.a.), the same rate as October’s reading of 3.3% YoY and the consensus forecast at 3.3% YoY.
Inflationary pressures are primarily concentrated in the core service sector with an increase of 4.6 % YoY, below the 4.8% (YoY) observed in October. In contrast, the goods sector is experiencing deflation with a decrease of 0.6% YoY, lower than the 1% YoY decrease in October.
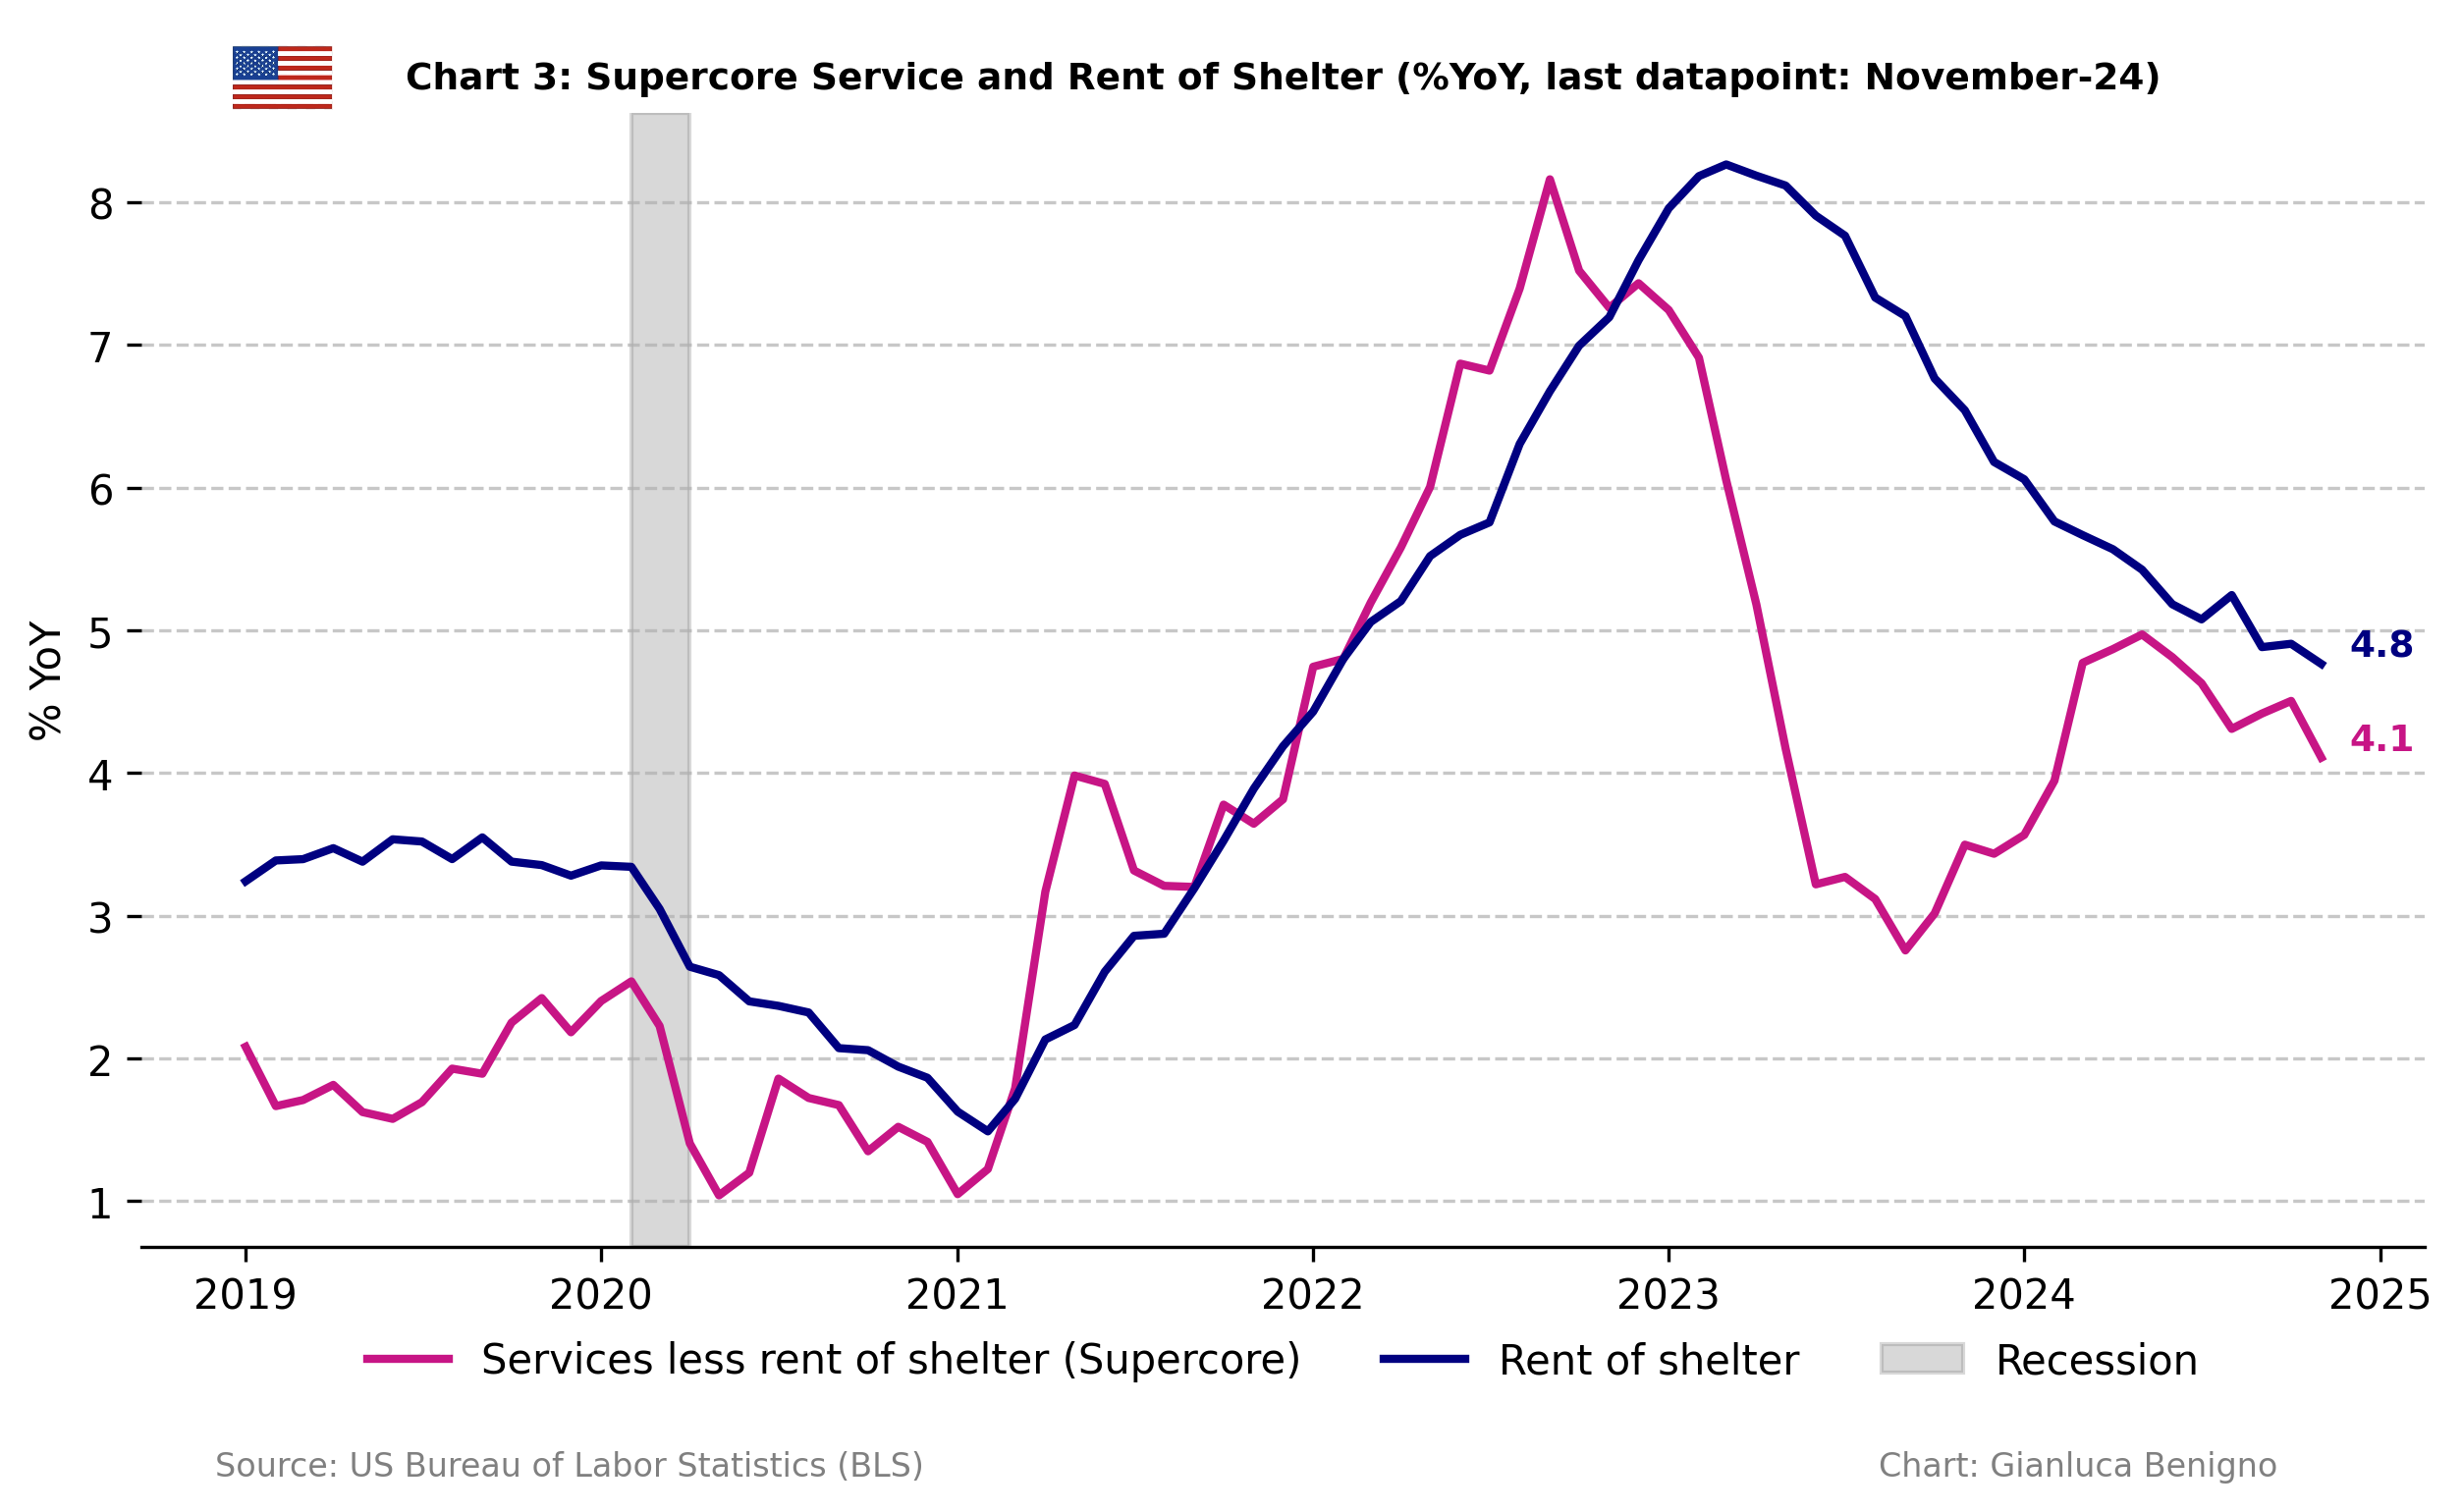
The primary factor behind recent inflationary pressures is still the shelter component of the Consumer Price Index (CPI). Shelter increased by 4.7% YoY in November, lower than the 4.9 %YoY recorded in October. The month-on-month increase was 0.2%, slightly below October’s 0.3% MoM.
The current reading is consistent with a slow benign disinflationary process but the latest releases suggest at best a very slow pace in the adjustment towards the 2% target. This is due to the persistence of core service inflation and its housing component. Another interpretation is that core inflation has reached a plateau stabilizing around 3% YoY. While the current release is consistent with the continuation of the easing cycle at the December meeting, further rate cuts will be conditioned on inflation improvements or a deterioration of the labor market.
Related posts (with links)
U.S. October-24 CPI Inflation Report (previous release)
U.S. September-24 CPI Inflation Report (previous release)
US August-24 CPI Inflation Report (previous release)
US July-24 CPI Inflation Report (previous release)
US June-24 CPI Inflation Report (previous release);
US May-24 CPI Inflation Report (previous release);
50 or 25 bps? The cut that could split the Fed (context post);
Post FOMC update: the Fed and the Market Shifts (context post);
Review of the Inflation Release
The Consumer Price Index (CPI) rose by 2.7% (n.s.a.) year-on-year in November (Chart 1), which is in line with the market consensus (2.7% YoY) and above October’s figure of 2.6% YoY. On a month-on-month basis, there was a decline of 0.1% MoM (n.s.a.), below the market consensus of 0.3% and October’s figure of 0.1% MoM.
Core CPI (excluding food and energy) increased by 3.3% year-on-year (Chart 1), which is in line with the market consensus of 3.3% YoY and October’s figure of 3.3% YoY. On a month-on-month basis, core CPI rose by 0.1%, below the 0.2% increase recorded in October and below the consensus forecast of 0.3% MoM.
Core services (services excluding energy) remain the primary driver of inflationary pressures. In October, core services increased by 4.6% YoY (below the 4.8% YoY recorded in October), while core goods (goods excluding energy) experienced another decline, by 0.6% YoY (a lower decline than the 1% YoY decline recorded in October). The current release confirms that core CPI inflation is adjusting very slowly, largely due to the gradual adjustment of core services.
The following chart (Chart 2) illustrates this dichotomy between core goods and core services:
The CPI in November was primarily driven by the housing component (Tables 1 and 2). The overall shelter component rose by 4.7% year-on-year in November, lower than the 4.9% YoY recorded in October. Noticeably, on a month-on-month basis, the shelter component increased by 0.2%, slightly below the 0.3% increase recorded in October.
Supercore services (core services excluding shelter – Chart 3) increased by 4.1% year-on-year, well below the 4.5% increase in October. On a monthly basis, the supercore component has increased by 0.1% MoM lower than the 0.3% MoM observed in October.
Core services (excluding energy) prices increased by 4.6% year-on-year in November, lower than the 4.8% YoY recorded in October. On a month-on-month basis, core services increased by 0.2%, slightly lower than the 0.3% MoM increase recorded in October.
Core goods (excluding food and energy) prices continued their deflationary trend, declining by 0.6% year-on-year in November, lower than the 1% YoY decline recorded in October. On a month-on-month basis, core goods decreased by 0.4% in November, lower than the 0.3% MoM rise in October and the 0.4% MoM increase recorded in September.
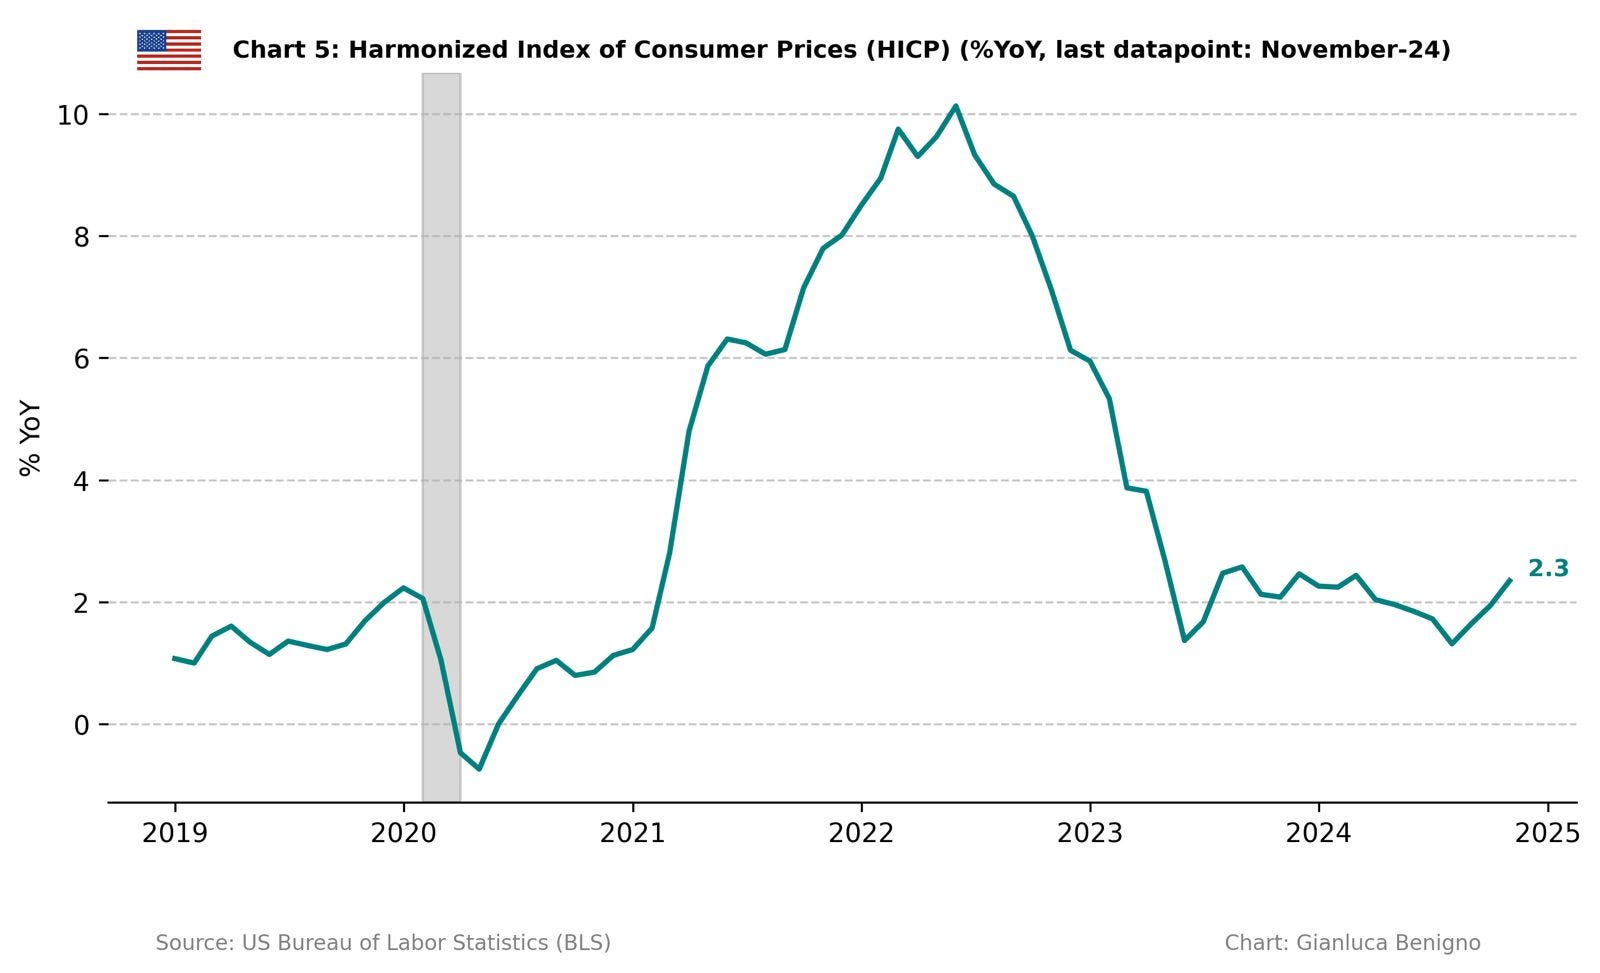
The Bureau also published the Harmonized Index of Consumer Prices (HICP), following the ECB’s methodology. According to the BLS: “The HICP differs from the U.S. Consumer Price Index (CPI) in two major respects. First, the HICP includes the rural population in its scope. Second, and probably more importantly, the HICP excludes owner-occupied housing”.
Chart 5 reveals that by excluding the owner-occupier rent component from the CPI, the inflation rate has ticked higher, at 2.3% in November compared to 1.9% (n.s.a.) year-on-year in October 2024.
Summary
The overall pattern of inflation till September 2024 reinforced the Fed’s confidence in the disinflationary pattern of inflation towards the 2% target as they started the easing cycle in September 2024 and continued it with a 25bps cut in November. The November data does not rule out another 25 basis points cut in December. However, recent releases indicate that core inflation has plateaued, stabilizing around 3%. Core services inflation remains elevated above 4.5%, driven primarily by persistent housing costs. My overall view is that the persistence in core inflation is likely to pause the easing cycle in 2025, barring a significant weakening in the labor market.
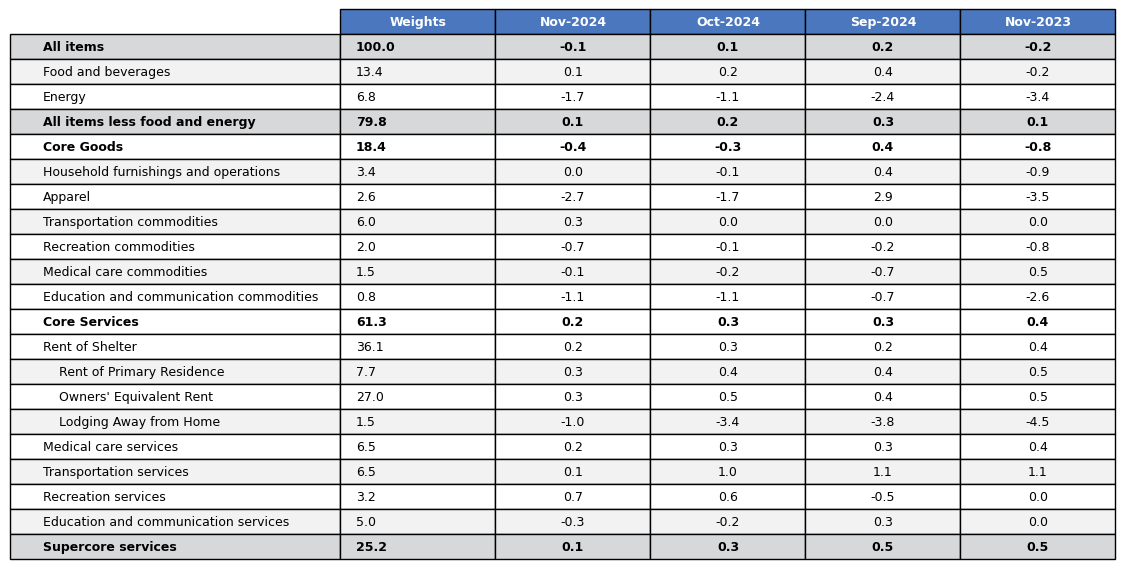
Table 1: CPI by components (% YoY)

Source: Bureau of Labor Statistics (BLS).
Table 2: CPI by components (% MoM)
Source: Bureau of Labor Statistics (BLS)