
Tariffs as a Financial Event
Large scale tariff shock has set in motion financial deleveraging

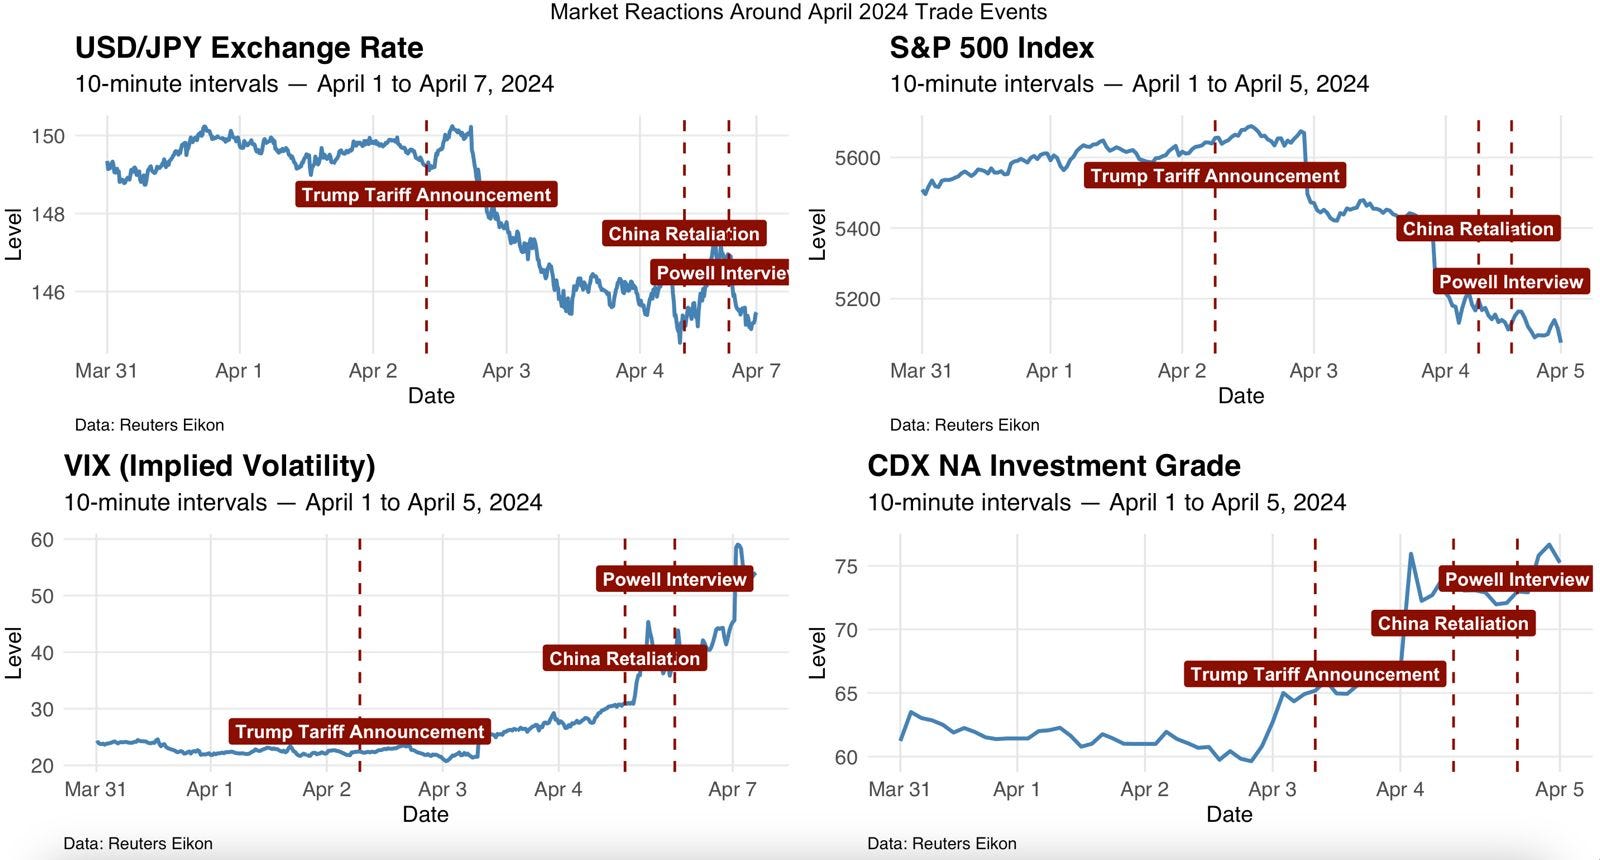
The previous charts illustrate the mounting financial market stress triggered by the April 2nd announcement of the new U.S. tariff policy by President Trump at high-frequency intervals (10 minutes in the last 8 days up to April 7th).
The VIX—a widely used gauge of market volatility and investor fear—spiked to above 40, levels usually associated with panic in financial markets1. The S&P 500 has declined by over 10%, while the USD/JPY exchange rate, often viewed as a proxy for risk-off sentiment, has also strengthened. Meanwhile, credit spreads, as measured by the CDX NA IG index—which tracks CDS spreads on a basket of high-grade corporate bonds and serves as a proxy for credit risk in the safest segment of the corporate market—have also widened considerably.
In my previous blog (“A Quick Guide to the New Trade U.S. Regime”), I outlined the key features of the new U.S. administration’s trade policy actions. In this post, I explain why this might not merely be a tariff shock but is rapidly evolving into a financial event. Since the policy announcement on April 2nd, two additional developments have further amplified the financial consequences of this initial structural shift.
The two key developments are:
China’s retaliatory measures include 34% tariffs on U.S. imports and potential restrictions on rare earth mineral exports. (Note: so far, this is the most relevant retaliation action taken in response to the new administration policies. President Trump has threatened a further 50% increase on imports from China if these retaliatory measures are not withdrawn as of the 7th of April, 2025. This will magnify the fracture between the U.S. and China, which is, in my opinion, at the core of what is happening.)
Federal Reserve Chair Powell’s interview emphasized the risk that the larger-than-expected tariff hikes could contribute to more persistent inflation.
In this blog, I address the following points:
1. What makes this shock different: This episode cannot be analyzed through the lens of standard textbook tariff shocks. It shares more in common with major structural breaks, such as the COVID-19 shock, and requires a different conceptual framework.
2. The amplification mechanism:
While not entirely new, the current situation highlights a well-known amplification channel that policymakers must now explicitly acknowledge.
3. A brief interpretation through the R** lens (The Financial Instability Real Interest Rate, R** }
4. Where does this stop?
At present, there is no clear stop to this process. Further escalation risks can lead to a major financial market event. Partial policy retrenchment could help, and opening to negotiations by the U.S. administration and other countries could be a welcome development, too.
Introduction: When Trade Policy Becomes a Financial Catalyst
In traditional macroeconomics, tariffs are understood as instruments of trade policy. They are expected to influence patterns of production, consumption, and international trade balances. But under specific conditions—when asset markets are overvalued and investors are highly leveraged—tariffs can become financial events. That is precisely what is currently happening.
The recent imposition of sweeping “reciprocal tariffs” by the U.S. administration, targeting imports from basically all countries in the world, has triggered a broad-based financial repricing. These tariffs, ranging from 10% to 50%, represent not only a sharp break from prior U.S. trade policy but a shock of such magnitude that they have destabilized asset markets and investor expectations.
The financial consequences of this tariff shock cannot be understood merely through the lens of international trade theory. Instead, they require a framework that integrates financial fragility, asset valuation, and leverage dynamics—precisely the type of framework advanced by Charles Kindleberger and Hyman Minsky. 2
The Fundamental Shock: Size, Surprise, and Scope
The nature of the tariff shock matters. It is not just that tariffs were imposed, but how they have been imposed:
The size of the tariffs: broad-based, sweeping, and affecting a wide range of sectors.
The surprise: the market had not anticipated such a dramatic shift prior to the announcement.
The scope: all major countries impacted. Effectively a de-coupling of the U.S. economy from the current international trade system
Markets that had priced in a stable geopolitical environment and strong global growth have been forced to fundamentally reassess earnings potential, particularly for firms integrated into global supply chains or dependent on export demand. From this perspective, it is not surprising to see a decline in equity markets.
In particular, firms in manufacturing, semiconductors, industrials, and AI tech are particularly exposed. Expectations for future profits, growth, and even productivity gains—especially those predicated on global integration—have been revised downward. Equity prices have responded accordingly.
Now, what is important to note is that the reassessment, given the size of the shock, is not a minor one, and retaliation adds on this, further fracturing the system.
The Amplification Mechanism: Deleveraging and Margin Calls
The reassessment of fundamentals is only the first step in understanding the market reaction. What made the tariff shock financially explosive was the leverage structure underpinning asset markets in early 2025. Let me review this financial market dynamic first.
Understanding Deleveraging
Deleveraging is the process by which investors reduce their borrowed positions in financial markets. In boom periods, rising asset prices often go hand-in-hand with rising leverage: investors borrow to magnify returns. But when prices fall, the dynamic reverses.
Leverage works both ways—it amplifies gains on the way up and losses on the way down.
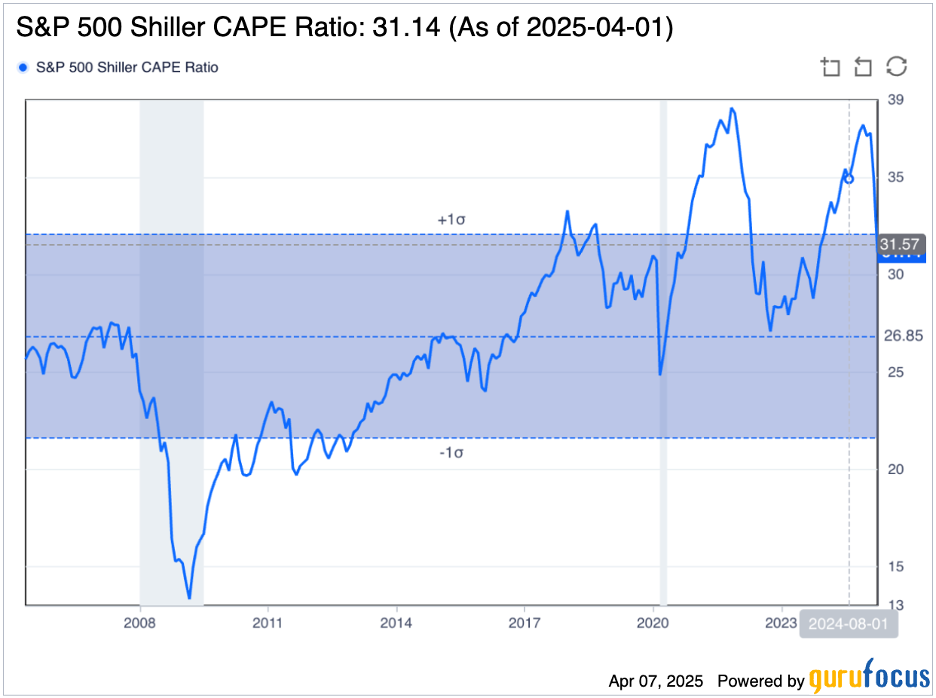
For background, entering 2025, equity markets were coming off a period of sustained euphoria, with valuations historically stretched. Price-to-earnings ratios were elevated, and the CAPE ratio—Cyclically Adjusted Price-to-Earnings, also known as the Shiller P/E ratio—stood above 41 as of February.
Risk appetite was high, with hedge funds, institutional investors, and even retail participants increasing exposure to equities through margin accounts, derivatives, and structured credit products.
When the tariff shock hit, falling prices began to erode collateral values. This initiated a deleveraging loop.
What Are Margin Calls?
Margin calls are at the heart of this process.
When investors borrow to buy assets—typically via a brokerage margin account—they post collateral (e.g., the assets they are buying). Lenders require a minimum collateral ratio, which must be maintained as market values fluctuate. If asset prices decline and the ratio falls below the required threshold, the broker issues a margin call: the investor must either post more collateral (cash or assets) or sell part of their position.
Failure to meet a margin call results in forced liquidation—the broker sells the position to protect against further loss.
This mechanism creates an automatic procyclical feedback loop:
Asset prices fall
Margin calls are triggered
Investors sell to meet calls
Selling pressures prices further
New margin calls occur
Repeat
This is not a psychological phenomenon—it is mechanical and highly nonlinear.
From Tariff to Financial Spiral: The Causal Chain
What I would like to do here is to briefly relate how the causal logic from the tariff shock to financial distress could be interpreted in Kindleberger-Minsky’s terms. In his classic Manias, Panics, and Crashes: A History of Financial Crises (1978), in Chapter 2 of the book, Kindleberger presents a stylized model of how financial crises unfold. This sequence is based on Minsky’s Financial Instability Hypothesis but is adapted with Kindleberger’s historical lens. The model includes the following stages:
Displacement
A significant shock or innovation (e.g., new markets, technology, deregulation, or policy change) alters expectations and sets off new profit opportunities.Credit Expansion and Boom
Banks and financial institutions respond by expanding credit. Asset prices begin rising, and optimism builds.Euphoria and Speculation
Investors begin speculating, often borrowing to buy assets (leverage). A sense of “this time is different” takes over. Asset prices rise rapidly, decoupling from fundamentals.Financial Distress
Some insiders start selling. Credit tightens. Leveraged investors face difficulty refinancing. Confidence begins to erode.Crisis and Crash
A trigger event or realization causes widespread panic. Prices collapse, margin calls proliferate, and liquidity dries up. Financial institutions fail.Contagion and Spillover
The crisis spreads to other sectors or countries. Investors become risk-averse, causing broader capital flight and economic contraction.Policy Response and Recovery
Governments and central banks intervene to stabilize the system. Recovery can be swift or prolonged, depending on the scale of leverage and policy action.
Here, I adapt this framework to the current environment.
Displacement: The introduction of reciprocal tariffs is the initiating shock—unexpected, system-wide, and policy-induced.
Reassessment: Equity markets reprice earnings expectations downward. AI productivity gains, global demand, and supply chain resilience are all in question.
Declining Prices: High-growth stocks, particularly in AI and manufacturing, suffer sharp losses.
Margin Dynamics: Investors who were long equities via borrowed funds are hit with margin calls.
Deleveraging Spiral: Forced selling drives further price declines. Volatility rises. Liquidity thins.
This is what is happening so far up to Friday. The opening of the week, on Monday, the 7th of April, captured phase 6.
Contagion: Credit spreads widen, Treasury yields fall further, and global equities decline sharply. Investors flee to cash and government bonds.
This sequence explains why a policy event that is still interpreted as a textbook trade shock by several models is now becoming a macro-financial event.
As you might have noted, what is missing is the last step: the policy step or stop. But before addressing it, it is useful to review the inflationary context.
Deflationary or Inflationary? Size Matters
One of the more subtle aspects of this crisis is the inflation question. Please see also my earlier blog in which I discuss the partial equilibrium perspective on how tariffs affect inflation (“A Quick Guide to the New Trade U.S. Regime”).
In small size, tariffs could be inflationary—they raise the price of imports, shift consumption, and pressure domestic supply. But this time is different.

But large-scale tariffs, imposed in a leveraged environment, have a very different effect. They:
Depress earnings expectations
Trigger asset price corrections
Amplify risk aversion
Lead to deleveraging and credit tightening
We would need to think in terms of a framework in which these dynamics interact with traditional effects. Note also that there is a key difference between the two in terms of timing. The traditional textbook effect is slow-moving and projected in the next quarters, but the financial market response to the anticipation of a major tariff shock is fast-moving, materializing over days or weeks. This creates a fundamentally different short-run dynamic than what we would expect from a small, anticipated tariff change.

In short, potentially, the net effect is financially deflationary—not because tariffs reduce prices directly but because they contract aggregate demand through wealth effects and financial stress.
Policy Dilemma: Monetary Tools vs. Trade Instruments
Faced with falling markets, rising credit spreads, and slowing demand, central banks face a familiar question: Where is the policy “put”?
In 2018–19, the Powell Fed interpreted tariffs as mildly inflationary and growth-negative. The response was calibrated: rate cuts and liquidity support.
In 2025, this playbook looks insufficient.
This is no longer a dispute over steel or soybeans. The tariff shock is systemic, with financial and macro implications. It requires a richer response framework—one that recognizes the interaction between policy shocks and financial fragility. As I mentioned above, partial policy retrenchment could help, and opening to negotiations by the U.S. administration with other countries could be a welcome development, too.
One way to structurally interpret the unfolding events is through the lens of the financial-instability-adjusted real interest rate, or R**. The tariff shock—coupled with downward revisions to growth expectations—has weighed heavily on asset prices and valuations, leading to a sharp decline in R**.
This assessment could be conducted by monitoring the high-frequency version of our R** concept and comparing it with the current interest rate.
Currently, as I noted above, there is no stop (or put) to financial market dynamics. My initial assessment is that someone has to give in.
The Way Forward: Recognize the Financial Dimension
This episode makes one thing clear: this large tariffs shock must now be understood as a macro-financial event. When used at scale, in fragile financial environments, they do not just distort trade—they threaten financial stability.
Policy choices now matter more than ever:
Monetary policy can cushion the blow but cannot undo the initial shock but most likely with the financial consequences of it.
Fiscal targeting (e.g., aid to affected firms) can reduce the damage but not eliminate it.
Trade diplomacy may offer the only path to reversing the underlying driver of the crisis.
Conclusions
Kindleberger’s insight—that financial events begin with a displacement but are amplified by financial structures—is potentially relevant. The 2025 tariff shock is not just an economic event. It is a trigger that is once again exposing the vulnerabilities of a highly leveraged, speculation-driven market.
A simple classification. VIX Below 15: Low Volatility (Calm Market): Indicates low investor fear and a stable market. 2. VIX Between 15 and 25: Normal Volatility: Suggests moderate uncertainty in the market. 3. VIX Above 25: High Volatility (Fear & Uncertainty): Reflects high investor fear and market instability and often coincides with market corrections 4. VIX Above 40: Extreme Fear (Market Panic) Seen during major market crashes (e.g., 2008 financial crisis, COVID-19 selloff in 2020).
See Kindleberger, “Manias, Panics, and Crashes: A History of Financial Crises”, first published in 1978, a foundational work in the study of financial instability and crises, heavily influenced by the theories of Hyman Minsky, especially the financial instability hypothesis, see chapter 2 of the book.