The Fed’s Immaculate Disinflation Journey
The Fed’s Narrative on the 2022-23 disinflation through the dot-plot perspective.
In this post, I review how the end of 2023 dot-plots have evolved from the beginning of the tightening cycle. I identify three phases:
The initial Immaculate view: the Fed embarked on a policy-tightening path with an anticipation of an immaculate disinflation process.
The Monetary Policy Disinflation phase: from June 2022 up to March 2023 the median committee member adjusted its forecast indicating a trend towards higher unemployment, subdued economic growth, along with an increase in the real interest rate.
Back to Immaculate: from June 2023 the median committee shifted towards a more favorable view, reflected in upgraded GDP growth forecasts, reduced unemployment rates, and lower end-of-the-year inflation.
I will conclude by interpreting the Fed’s journey and offer some insights that could be useful in studying the policy challenges in 2024.
Background
In what follows I examine the Federal Reserve's 2023 economic outlook through the perspective of the the median Federal Open Market Committee (FOMC) member, focusing on its evolution for the end of 2023 forecast. This assessment will be restricted to the Summary of Economic Projections (SEP) from the onset of the tightening cycle in March 2022 through December 2023, encompassing eight SEP releases. I will concentrate on the projected economic outcomes for the end of 2023—focusing solely on the median—and how they have shifted throughout the policy tightening phase.
The Immaculate Disinflation Perspective
As a background, at the beginning of the tightening cycle, in March 2022, PCE inflation was at 6.6 percent with the corresponding core reading at 5.2 percent. The unemployment rate was at 3.6 percent.
Back in March 2022, the FOMC through its SEP projection interpreted the inflation surge as a relatively long-lasting outcome but benign in nature.
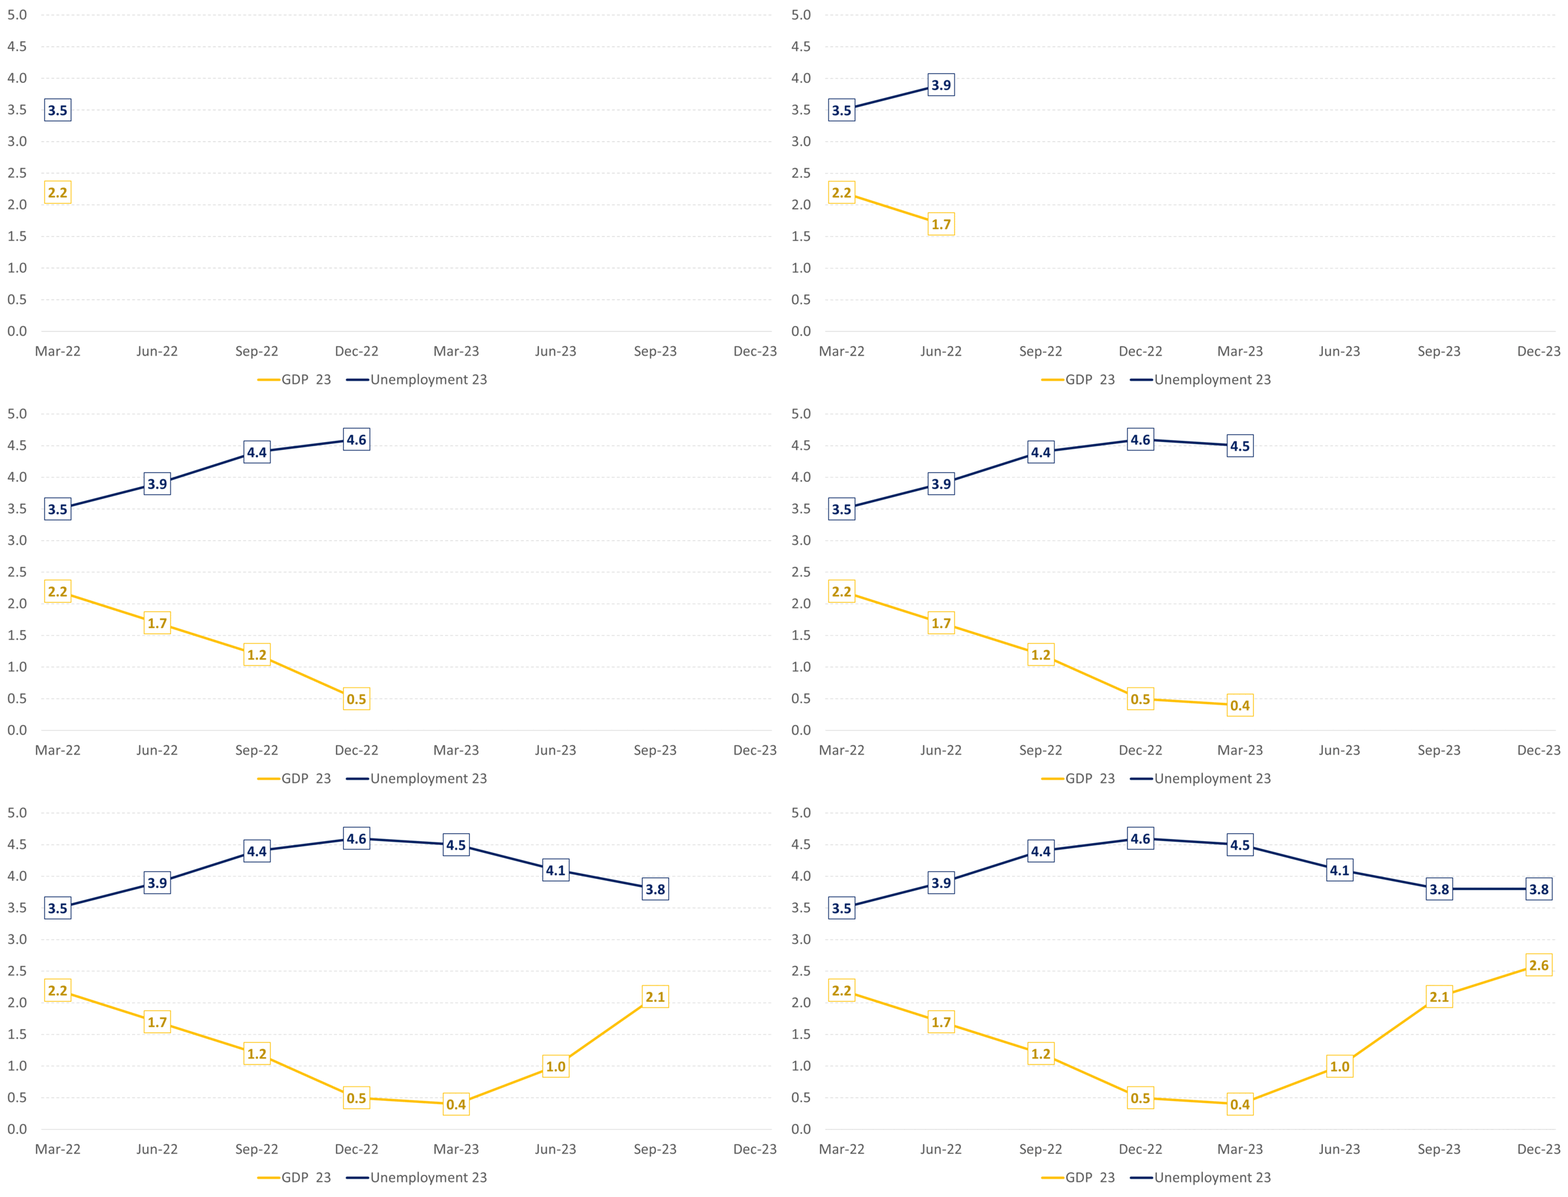
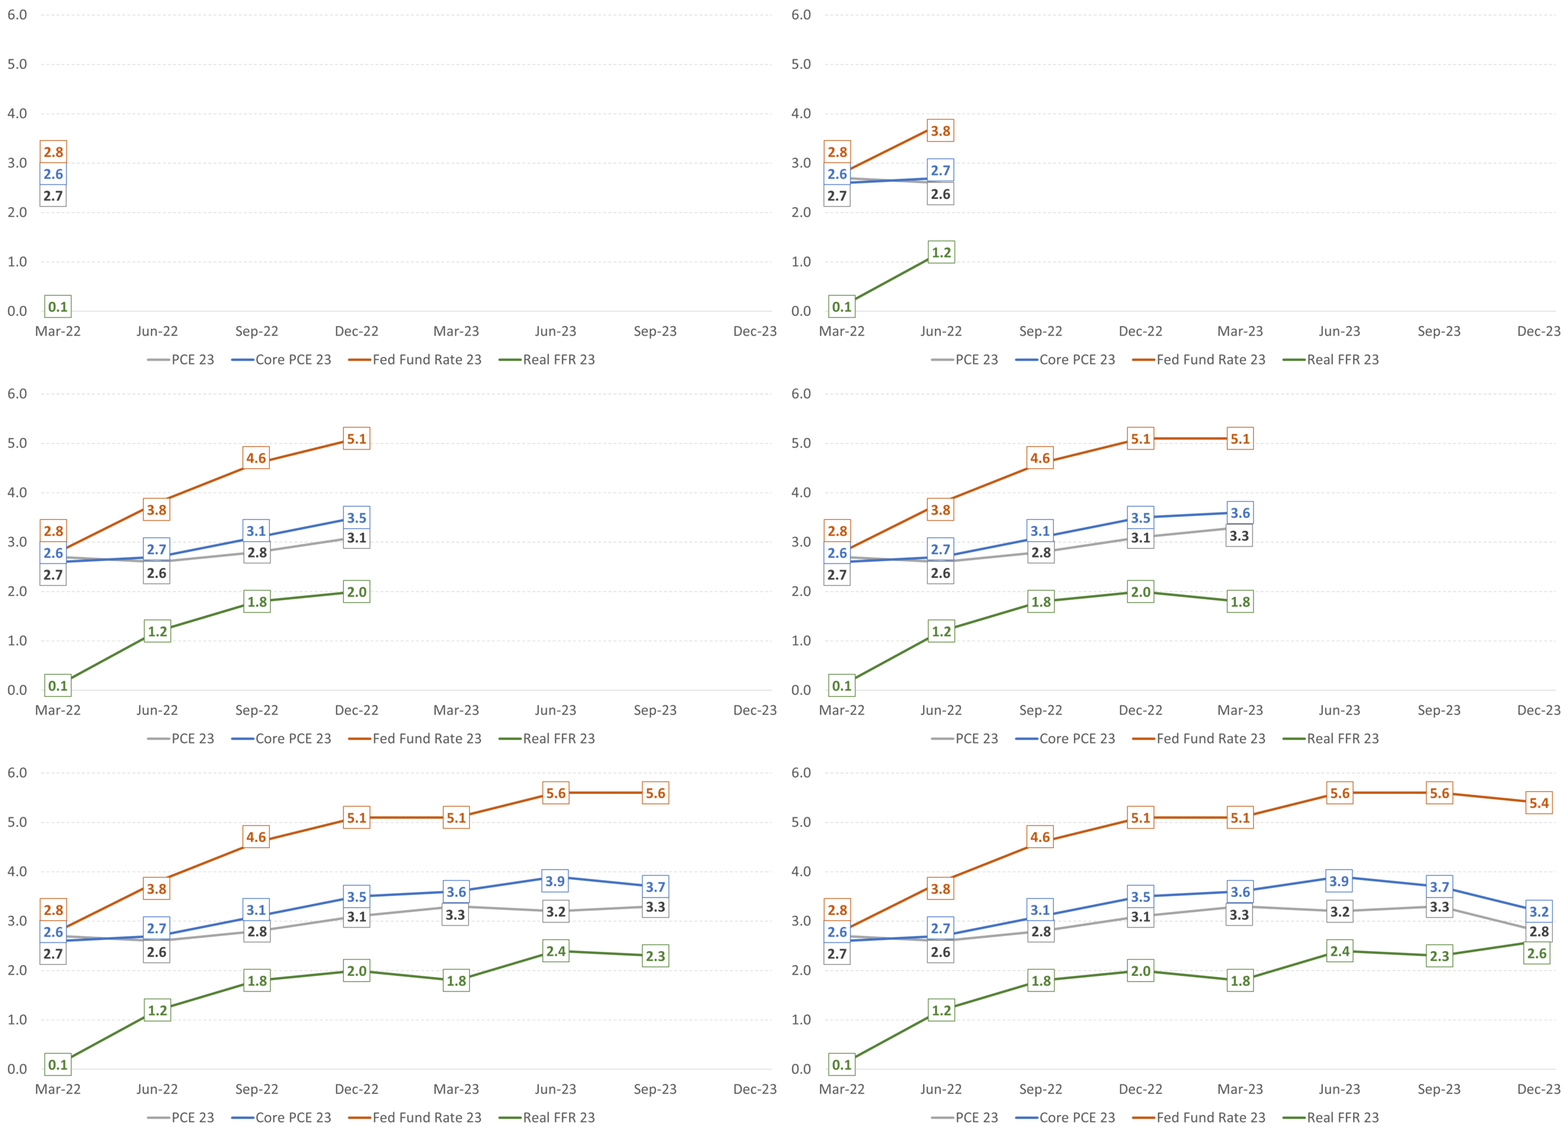
The median FOMC member's forecast at that time did not anticipate an increase in unemployment, maintaining it at 3.5% for the end of 2023, with both headline and core PCE inflation rates projected to converge at 2.7% and 2.6%, respectively. The growth in GDP for 2023 was estimated at 2.2%, which was above the long-term trend-growth projection of 1.8%. The real interest rate, adjusted post hoc for headline PCE inflation, was projected to be slightly above zero, at 0.1% at the end of 2023. Essentially, the envisioned outcome was one consistent with immaculate disinflation, with a real interest rate of 0.1% below the longer-run neutral estimate, which at the time was set at 0.4%.
Shifting View: the needed slowdown
The following table collects the evolution of the end of 2023 forecast through the various SEP since March 2022.
By examining the table and the evolution of the median FOMC member it's possible to identify two distinct phases.
In the initial phase, the Fed began to anticipate diminished economic growth, adjusting expectations from the initial 2.2% down to a mere 0.4% by March 2023, considerably below the long-term projection of 1.8%. Unemployment projections were also corrected upwards from 3.5% to 4.5%, alongside an increase in both inflation forecasts and nominal and (ex-post) real interest rates.
Such a shift aligns with the conventional functioning of monetary policy. The tightening measures were expected to temper demand, leading to a downturn in GDP growth and an increase in unemployment, to contain inflation.
The end of this initial phase would come after March 2023, with the Silicon Valley Bank (SVB) crisis, PCE inflation was recorded at 4.2% for the headline and 4.6% for the core. The unemployment rate remained at 3.5%, and the real GDP growth for the second quarter of 2023 was at 2.4%.
Back to Immaculate
In this second phase, starting from June 2023, it started becoming apparent that the economy was more resilient to higher interest rates than initially thought. The effective policy response, particularly through the Bank Term Funding Program (BTFP), played a significant role in stabilizing the banking sector amid the turmoil. In light of these developments, the median FOMC member began to adjust its projections, reflecting an uptick in economic growth and slowing inflation rates. Interestingly while pivoting in terms of nominal interest rate, the ex-post real interest rate increased well above the long-run neutral rate of 0.5 percent.
Conclusions
Forecasting the economy is not an easy task, yet the initial insight of the Federal Reserve captured by the median FOMC member was quite accurate. The economy at the end of 2023 has performed better than what the median FOMC member forecasted at the beginning of the tightening cycle. Inflation is still above the FED’s comfort zone, but its adjustment has occurred without a significant impact on the real economy.
The main difference relative to the initial view is that nominal and real (ex-post) interest rates are higher than what was initially envisaged.
What do we learn from this analysis?
a) The reversal of supply shocks (global supply chain and energy) has been the main driver in determining the reduction of inflation.
b) Keeping aside considerations in terms of the lag through which monetary policy operates, the economy appears to be more robust against higher nominal and real interest rates than expected.
c) It might well be that the neutral interest rate (at least in the short run) is higher than the long-run neutral one and monetary policy has been relatively accommodative throughout (this is in contrast with Powell claiming that it is quite restrictive).
d) The overall adjustment (see also my initial post on the Federal Reserve’s policy stance) seems to be consistent with monetary policy that has normalized as opposed to being restrictive.
e) It's possible that monetary policy played a role in stabilizing inflation expectations, although it's challenging to pinpoint this accurately since inflation expectations could have also been impacted by the reversal of supply shocks.
f) The other possibility is that the economy following the pandemic shock has operated on the vertical side of the Philipps curve with limited ability to supply dictated by labor or inputs capacity constraints. (see “It is baaack: the surge in inflation in 20202s and the return on the non-linear Phillips curve” by Benigno, P., and G. Eggertsson)


