The Inflation Myth
A cross-country comparison
To rephrase a claim of a current prominent policy maker “Is it a myth that the inflation trajectory would have been the same in the absence of monetary policy action?
In this blog post, I compare the experience of four major economies/Central Banks: the U.S., the Euro area, the U.K., and Japan.
As the above graph highlights, the Bank of Japan has been an outlier in terms of monetary policy response to post-pandemic inflation. The Bank of Japan has kept its main rate negative for most of the sample period (raising it at the March 2024 policy meeting), while marginally adjusting the 10-year rate under the yield control policy (and eliminating it also at the March 2024 meeting). Nevertheless, the trajectory of CPI in Japan parallels those of the other countries. A consequential outcome of this policy divergence has been the substantial depreciation of the Yen, but this is not the focus of this blog/analysis.
If we compare the Japanese experience along other Central Banks, one might be tempted to conclude that the inflation trajectory could have been the same as the one that we have observed with very limited monetary policy action. To put it in another way, how do monetary policy actions transmit into the economy?
In this post, I argue that:
Monetary policy might have played a role in stabilizing inflation expectations instead of slowing down economic activity.
The lack of effects of the tightening cycle on unemployment raises questions about the tightness of monetary policy and/or its effectiveness.
The behavior of CPI service inflation, particularly in its housing component, suggests that tightening monetary policy may paradoxically lead to inflationary pressures—a phenomenon I have labeled the "Catch-22 effect." This paradox is evident in the persistent high service inflation rates observed across various regions, despite aggressive monetary tightening measures.
Global factors rather than domestic ones have mainly driven the inflation trajectory. (see also the CEPR Geneva Report no 26 by V. Guerrieri, M. Macussen, L. Reichlin, and S. Tenreyro).
Background
Major central banks, with the exception of the Bank of Japan, have significantly raised their policy rates in response to the post-pandemic surge in inflation. This aggressive policy response aimed at counteracting persistent inflationary pressures, preventing the de-anchoring of inflation expectations, and limiting the risk of wage-price spirals.
As a background, it's important to note that the inflationary developments were welcomed by the Bank of Japan. Along with the yen's depreciation and a tight labor market, these factors created the virtuous cycle that Japanese policymakers have long sought.
As I mentioned in other blog posts, major central banks base their reasoning on the mainstream New Keynesian model, where monetary policy operates by managing aggregate demand. A key concept in this approach is the natural real interest rate. The monetary policy stance is determined by comparing the current real interest rate with the reference natural rate, r*. (see “Quo vadis, r*? The natural rate of interest after the pandemic”)
In its simplest form, an increase in the nominal interest rate that raises the real interest rate above the natural rate leads to a decline in aggregate demand below its potential, thereby initiating the disinflationary process. Conversely, policy would be accommodative if the real interest rate is below r*.
In the recent tightening cycle, the logic behind the policy action can be divided into two phases. The first phase involves achieving policy neutrality by raising the interest rate to the natural level. The second phase consists of further tightening, raising interest rates above the natural level to control inflation, reflecting a restrictive monetary policy stance. By the second half of 2023, as interest rates peaked, the Fed, the ECB, and the Bank of England have asserted that they have achieved a restrictive stance.
Is monetary policy restrictive?
In “Juxtaposing the ECB and the Fed: Who Should Cut First?”, I argued that monetary policy in the U.S. and the Eurozone may have only become restrictive in 2023, at best. This assessment is based on estimates of the natural real interest rate (r*), such as those from HLW, which suggest that real natural rates remain low or similar to pre-pandemic levels. Restrictive monetary policy is expected to result in higher unemployment; however, unemployment has remained historically low and stable.
If we employ other measures of the natural real interest rates (see for example, Lubik and Matthes, 2023), the estimate would be around 2.2% end of 2023 which would be approximately consistent with a neutral stance from the Federal Reserve.
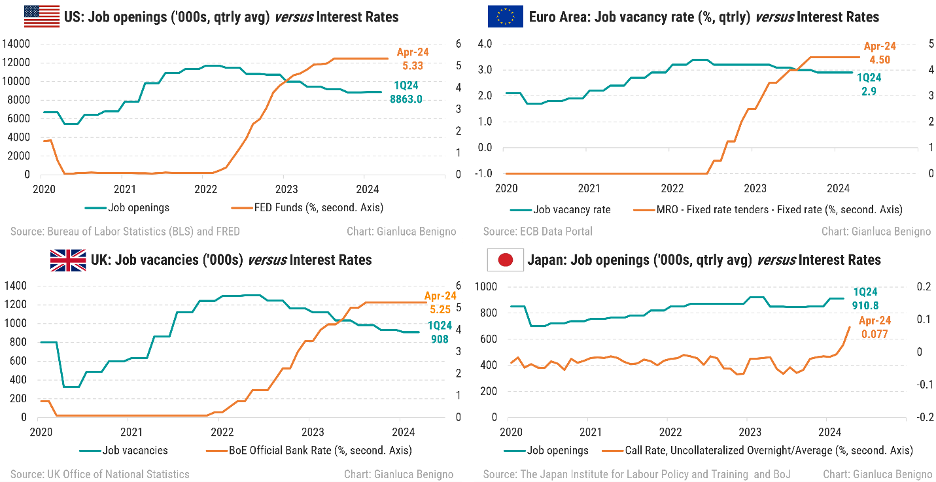
One way to understand the role of monetary policy is through the mechanism illustrated in Benigno and Eggertsson, 2023. In their setting, the economy operates on the vertical part of the Phillips curve, and monetary policy rebalances the labor market by reducing the vacancy rate. This is the most recent narrative from the Federal Reserve in interpreting the effects of monetary policy actions. The following graph shows the decline in job openings as monetary policy tightens, except in Japan, where job openings have slightly increased.
Inflation expectations
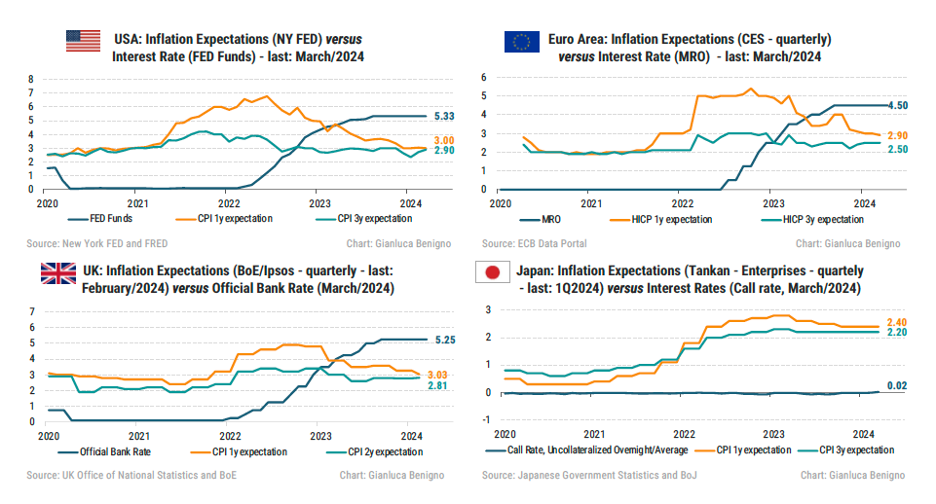
One argument policymakers have used to justify the tightening cycle is the need to anchor inflation expectations. For this analysis, I use consumer surveys to measure inflation expectations, except for Japan, where I use the Tankan survey. The next graph shows one-year-ahead and three-year-ahead inflation expectations for the U.S., the Euro area, and Japan, and two-year-ahead expectations for the U.K., plotted against the main policy rate.
The narrative that inflation expectations have reversed as policy rates have increased is somewhat consistent with the patterns observed in the U.S., Euro area, and the U.K. From Japan’s perspective, however, the rise in inflation expectations was a positive development, as inflation levels from the Tankan survey now align with the Bank of Japan’s 2 percent target.
Identifying the role of monetary policy in stabilizing inflation expectations is challenging because, during the same period, we saw the reversal of two major shocks to the global economy: supply chain disruptions (as indicated by the Global Supply Chain Pressure Index) and energy prices.
Therefore, the stabilization of inflation expectations in countries that raised their policy rates can also be attributed to the reversal of these shocks.
More broadly, the impact of global shocks, particularly supply chain disruptions, is a topic I have previously highlighted in several blog posts with my former colleagues at the Federal Reserve Bank of New York. See for example “The Global Supply Side of Inflationary Pressures”, Jan 2022, and “How Much GSCPI Improvement Helps Reduce Inflation”, Feb 2023.
The stickiness of core service inflation
One notable aspect of recent inflation trends is the persistence of service inflation. In the Euro area, CPI service inflation has remained at around 4% for the past six months, while in the U.S. it stands above 5%, and in the U.K. around 6%. In contrast, Japan's CPI service inflation reached 2% in July 2023, aligning with the Bank of Japan's target, and recently dropped to 1.7% after 9 months of around 2%.
I have argued that higher interest rates might exacerbate the housing component of inflation by increasing rental costs for tenants, a phenomenon I labeled the "Catch-22 effect." This mechanism suggests that service inflation tends to be stickier when the shelter component comprises a larger share of CPI services.
Looking at the table above, we can see that housing inflation accounts for more than half of service inflation in the U.S., while its relative weight is smaller in the UK and the Euro area and much smaller in Japan. This observation is reflected in the persistence of the shelter component of CPI shown in the next figure:
As can be seen, the rise in service inflation is correlated with the housing component of inflation, except in Japan, where the weight of this component is small, and rent inflation has been contained. Notably, in both the U.S. and the U.K., the shelter component of the CPI exceeds overall service inflation. Conversely, in Japan, CPI service inflation is lower than the overall CPI index.
A related interpretation of the slow adjustment of service inflation is articulated in the CEPR Geneva report where the propagation of global shocks combined with a slow adjustment in service prices result in to persistent service inflation. This is an argument that is also implicitly reinforced in recent interesting research by Vlieghe (2024).
Conclusions
To conclude: “Is it a myth that the inflation trajectory would have been the same in the absence of monetary policy action?”
In this blog, I examine specific components of the monetary policy transmission mechanism.
A favorable interpretation of the role of monetary policy would suggest that:
- Monetary policy has been effective in anchoring inflation expectations and rebalancing the labor market.
A neutral interpretation of the role of monetary policy would argue that:
- Monetary policy has been ineffective. The common pattern of inflation across countries indicates the significant influence of global factors in driving inflation.
An unfavorable interpretation of the role of monetary policy would imply that:
- Monetary policy is contributing to higher rental prices within service inflation, thus slowing down the overall inflation adjustment (the Catch-22 mechanism).
What is your interpretation?


