China February-25 CPI Inflation Report
Deflation extends beyond Producer Prices to Consumer Prices
Key takeaways:
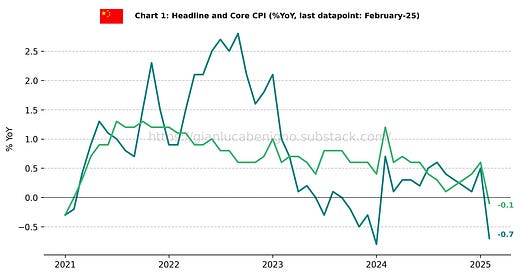
China's Consumer Price Index (CPI, non-seasonally adjusted) decreased by 0.7% year-on-year (YoY) in February, lower than the 0.5% YoY increase recorded in January.
Core CPI (excluding all food and energy) decreased by 0.1% YoY in February, down from the 0.6% YoY increase recorded in January.
Consumer goods inflation fell by 0.9 % YoY in February, in contrast to January’s 0.1% YoY increase. Service inflation fell by 0.4 % YoY, lower than the 1.1% YoY increase in January.
Food and Tobacco, and Transportation and Communication were the main categories contributing to the February negative headline reading: Food and Tobacco declined by 1.9% YoY in February, while Transportation and Communication declined by 2.5% YoY in February.
Producer Price inflation (all items) continued its deflationary trend in February, with a 2.2 % YoY decline, similar to the decline recorded by 2.3% YoY.
Overall, the data suggest that deflationary pressures have extended at the consumer level. The statistical office attributes the negative headline and core readings to seasonal factors related to the Lunar New Year. Even with the seasonal correction, headline consumer inflation would be marginally positive at 0.1% YoY. Persistent deflation at the producer level continues to reflect an excess capacity situation.
Related Posts
China January-24 CPI Inflation Report (previous release)
China December-24 CPI Inflation Report (previous release)
Review of the Inflation Release
In February 2025, consumer prices decreased by 0.7% year-on-year (YoY), lower than the 0.5% YoY increase recorded in January (see Chart 1) and lower than the consensus forecast of a 0.5% YoY decline. On a month-to-month basis (MoM), consumer prices decreased by 0.2%, compared to January’s 0.7% MoM ris.
Core inflation (excluding food and energy prices) fell by 0.1% YoY in February, lower than the 0.6% YoY increase observed in January. On a month-to-month (MoM) basis, it decreased by 0.2%, compared to the 0.5% MoM rise in January.
A relevant split that is provided at the level of China’s release is the distinction between consumer goods and services. In February 2025, consumer goods dropped significantly, declining by 0.9% YoY after registering a modest 0.1% YoY increase in January. On a monthly basis, consumer goods recorded a flat reading, following January’s 0.6% MoM increase.
Service inflation fell by 0.4 % YoY in February after posting a 1.1% YoY increase in January. On a monthly basis, February also saw a decrease by 0.5 % MoM in service inflation, a significant reversal from January’s 0.9% MoM increase.
Finally, in the case of China, we also report producer price indexes. Indeed, given China’s prominence in global manufacturing, producer prices provide a good indicator for thinking about global inflationary pressures at the goods level.
We report three categories:
All items
Means of production, and
Consumer goods
In February 2025, producer prices continued their long-running deflationary streak. Producer prices for all items declined by 2.2% YoY, following January’s 2.3% YoY decline. Similarly, producer prices (Means of Production) fell by 2.5% YoY in February – compared to the 2.6% YoY decline reported in January – indicating persistent lower input costs.
Finally, in February 2025, producer prices (consumer goods) declined by 1.2% YoY, replicating the January reading.
Summary
China’s inflationary outlook points to ongoing deflationary pressures at the consumer level and a persistent deflationary trend at the producer level. This combination reflects an economic environment of weak demand and excess capacity. In response to these challenges, further policy action appears likely.
The key question is to determine to what extent China might follow Japan’s steps into a deflationary trap.
Moreover, with the Trump administration announcing an increase in tariffs from 10% to 20% on Tuesday, Beijing will likely counter with strong fiscal measures to stabilize its economy and mitigate their impact.
Table 1: CPI by components (% YoY)
Source: National Bureau of Statistics of China
Table 2: PPI by categories (% YoY)
Source: National Bureau of Statistics of China
Table 3: CPI by components (% MoM)
Source: National Bureau of Statistics of China
Table 4: PPI by categories (% MoM)
Source: National Bureau of Statistics of China


