


UK November-24 CPI Inflation Report
Catch-22 on and running but more Hawkishness ahead

Key takeaways:
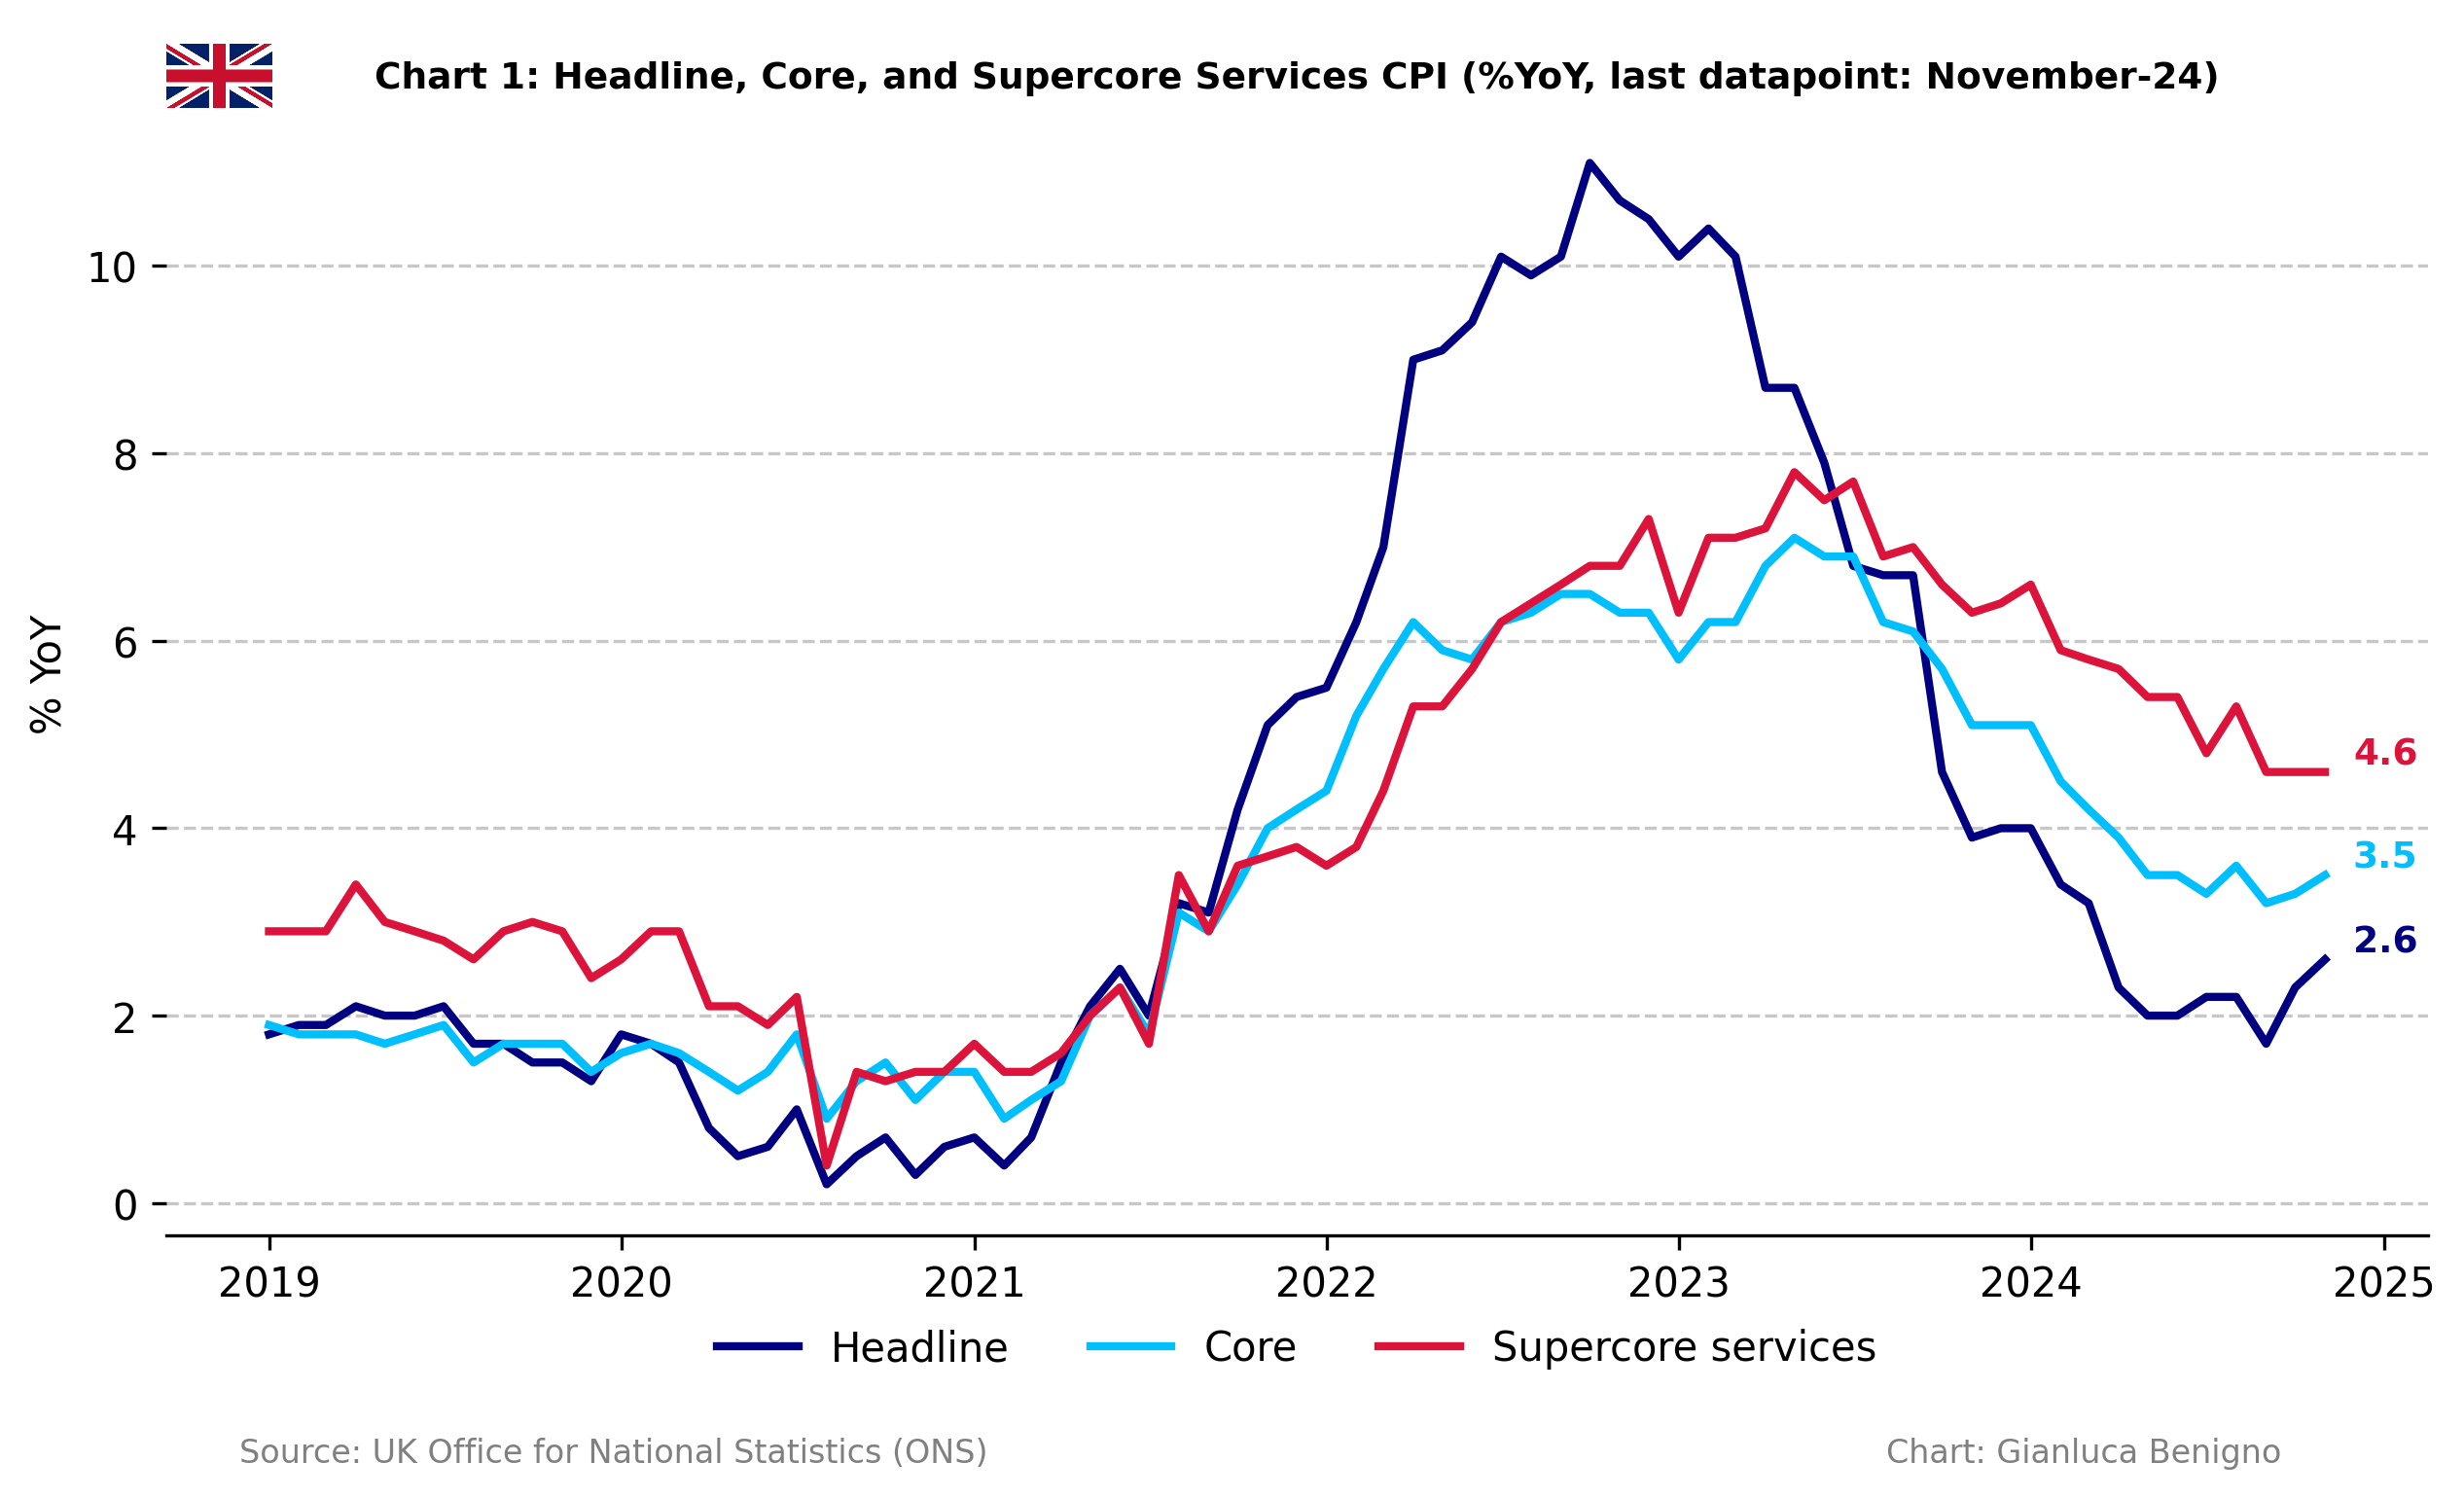
UK Consumer Price Index (CPI) increased by 2.6% year-on-year (YoY) in November, which is in line with the market consensus of 2.6% YoY and higher than October’s figure of 2.3% YoY.
Core CPI in November increased by 3.5% YoY, lower than the consensus forecast of 3.6% YoY but higher than October’s figure of 3.3% YoY.
Similarly to other advanced economies, inflationary pressures are primarily concentrated in the services sector, which saw an increase of 5.0% YoY in November, the same rate as in October. Meanwhile, the goods sector inflation turned positive rising 0.4% YoY, compared to October’s decline of 0.3% YoY.
Within the services sector, the main driver of rising inflation remains the housing component of the CPI. In November, actual rents for housing increased by 7.6% YoY (versus 7.4% YoY in October, 7.2% YoY in September and 6.4% YoY in November 2023).
Our supercore service inflation, which removes actual rents for housing, increased by 4.6% YoY, as of October.
This is the last inflation release before the Bank of England's monetary policy decision on Thursday (December 19th). The current consensus among analysts is that the BoE will keep its Official Rate unchanged at 4.75%. The latest data on wages – which posted a 5.1% increase (n.s.a.), above the prior 4.3% YoY (n.s.a.) reading – combined with current inflation numbers suggest a slow adjustment in core and service inflation. This validates, from the Bank of England's perspective, a gradual path of monetary policy normalization with no change in the Bank rate in December. Based on its current narrative, the Bank of England might turn more hawkish shifting towards a higher for longer restrictive stance.
Related posts (with links)
UK October-24 CPI Inflation Report (previous release)
UK September-24 CPI Inflation Report (previous release);
UK August-24 CPI Inflation Report (previous release);
Scenario Analysis as Communication Device for Central Banking (related post);
A Quasi-Global Inflation Overview (related post);
Has Wage Growth Fueled Inflation in the UK? (related post);
At the Core of UK Inflation (construction of supercore inflation and supercore wage index);
FT Alphaville on Catch-22 (short version of the Catch-22 effect);
Is the Bank of England in a Catch-22 Situation (long version of the Catch-22 effect);
Review of the Inflation Release
In November 2024, consumer prices increased by 2.6% year-on-year (YoY), in line with market consensus of 2.6% YoY and higher than the 2.3% YoY increase reported in October. On a month-on-month (MoM) basis, consumer prices increased by 0.1%, in line with the consensus forecast of 0.1% MoM, but lower than the 0.6% MoM increase recorded in October.
Core CPI, which excludes food and energy, rose by 3.5% YoY, slightly lower than the consensus forecast at 3.6% YoY but higher than October’s increase of 3.3% YoY (see Charts 1 and 2). On a month-on-month basis, core CPI was flat at 0%, much lower than the 0.4% rise recorded in October.

The services sector remains the primary driver of inflation, with an increase of 5.0% YoY in November, the same rate as the 5.0% YoY figure seen in October. On a monthly basis, service inflation declined by 0.1% MoM, lower than the 0.4% rise observed in October and a lower decline than the 0.3% recorded in September. Conversely, the goods sector inflation turned positive, recording a 0.4% YoY increase in November, higher than the 0.3% decrease observed in October. On a monthly basis, goods inflation increased by 0.3% MoM, sensibly lower than the 0.8% MoM increase recorded in October. Chart 3 highlights the dichotomy between the persistent inflation in services and the quicker adjustment in goods prices.
A distinctive feature of inflation developments in the UK has been the ongoing rise in housing inflation (what we refer to as the “Catch-22” effect), which has been the primary driver of inflationary pressures (Table 1). Actual rents for housing rose by 7.6% YoY, even higher than October’s and September’s figures – at 7.4% and 7.2%, respectively –, confirming the upward trend of housing prices seen since September 2021. On a month-to-month basis, rents increased by 0.6% compared to 0.5% MoM in October and 0.4% MoM in September.
Supercore services, as defined in a previous post (see Chart 4), increased by 4.6% YoY, the same rate as the 4.6% YoY recorded in October. On a monthly basis, it declined by 0.2% MoM in November, lower than the 0.4% MoM rise seen in October.

In this context, we’ve updated our supercore wage index after yesterday’s above-expected nominal wage data release (Chart 5). As can be seen, there was an increase of 5.4% YoY in October, higher than September’s 5.1% YoY upturn. Overall wages have also increased by 5.1% YoY (n.s.a.) higher than the 4.3% YoY (n.s.a.) increase observed in September.

Policy Implications
With the Bank of England’s decision due tomorrow, market consensus currently indicates that the committee will likely keep the policy rate at 4.75%. One of the key aspects of the policy decision, as highlighted in the latest Monetary Policy Report, is the persistence of service inflation and its relationship with inflationary wage pressures. The latest wage release indicates a significant increase in supercore wages and an increase in overall wages.
The current inflation outlook shows no significant progress in service inflation. A key driver of overall inflation is still the rental housing component which continues to trend higher. One possible interpretation of sustained service inflation could be linked to the propagation of higher housing costs to other sectors of the economy (“Catch-22” effect).
From the perspective of the Bank of England, this overall picture supports the gradual scenario of easing, with no change in the Bank rate at the December policy meeting. For 2025, according to Governor Andrew Bailey, the Bank of England expects four interest rate cuts if the economy outlook bears out but the combination of the latest wage data along with the slow adjustment in service inflation might lead MPC members to shift towards a more hawkish future stance.
Table 1: CPI by components (% YoY)

Source: UK Office of National Statistics (ONS)
Table 2: CPI by components (% MoM)

Source: UK Office of National Statistics (ONS)