Key takeaways:
UK Consumer Price Index (CPI) increased by 1.7% year-on-year (YoY) in September, lower than the market consensus at 1.9% YoY and August’s figure of 2.2% YoY.
Core CPI in September increased by 3.2% YoY, lower than the consensus forecast of 3.4% YoY and lower than August’s figure of 3.6% YoY.
Similarly to other advanced economies, these pressures are primarily concentrated in the services sector, which saw an increase of 4.9% YoY in September, lower than the 5.6% YoY observed in August. Meanwhile, the goods sector continues to experience deflation, this time of 1.4% YoY, lower than August's decrease of 0.9% YoY.
Within the services sector, the main driver of rising inflation remains the housing component of the CPI. In September, actual rents for housing increased by 7.2% YoY (versus 7.2% YoY in August, 7.1% YoY in July and 6.4% YoY in September 2023).
Our supercore service inflation, which removes actual rents for housing, increased by 4.6% YoY, sensibly lower than August’s figure of 5.3% YoY.
The Bank of England's monetary policy decision is due at the beginning of November, and the current consensus among analysts is that the BoE will lower the Bank rate by 25bps. The recent wage improvement appears to ease concerns about inflationary pressure. This current release with headline inflation below the target and the improvement of service and supercore inflation strengthens the case for continuing the easing cycle.
Related posts (with links)
UK August-24 CPI Inflation Report (previous release);
UK July-24 CPI Inflation Report (previous release);
Has Wage Growth Fueled Inflation in the UK? (related post);
At the Core of UK Inflation (construction of supercore inflation and supercore wage index);
FT Alphaville on Catch-22 (short version of the Catch-22 effect);
Is the Bank of England in a Catch-22 Situation (long version of the Catch-22 effect);
Review of the Inflation Release
In September 2024, consumer prices increased by 1.7% year-on-year (YoY), lower than the market consensus of 1.9% YoY and the 2.2% year-on-year reported in August. On a month-on-month basis, prices did not change, compared to the increase of 0.3% in August.
Core CPI, which excludes food and energy, rose by 3.2% year-over-year (YoY), lower than the consensus forecast of 3.4% YoY and lower than August’s figure of 3.6% YoY (see Charts 1 and 2). On a month-on-month basis, it increased by 0.1%, lower than the 0.4% increase recorded in August.
The services sector remains the primary driver of inflation, with an increase of 4.9% YoY in September, lower than the 5.6% YoY figure seen in August. Conversely, the goods sector continues to experience deflation, recording a 1.4% YoY decrease in September, a higher decrease than the 0.9% decrease observed in August. On a monthly basis, service inflation has declined by 0.3% MoM, lower than the 0.4% increase observed in August and the 0.5% increase recorded in July. On a monthly basis, goods inflation increased by 0.2% MoM, the same increase as in August but higher than the 0.8% MoM decrease seen in July. Chart 3 highlights the dichotomy between the persistent inflation in services and the quicker adjustment in goods prices.
As anticipated, the Catch-22 effect remained strong in September, with the housing component continuing to be the primary driver of inflationary pressures (Table 1). Actual housing rents rose by 7.2% year-over-year, unchanged from August and higher than the 7.1% YoY increase in July, reinforcing the upward trend observed since September 2021. On a month-to-month basis, rents increased by 0.4% (compared to 0.3% MoM in August and 1.7% MoM in July).
Supercore services, as defined in a previous post (see Chart 4), increased by 4.6% YoY, sensibly lower than the 5.3% YoY of August.
On a monthly basis, supercore service has decreased by 0.4% MoM in September, lower than the increase of 0.4% MoM seen in August.
In a recent post, we examined the relationship between supercore service inflation and supercore wages and found that wages have not been the primary driver of supercore inflation.
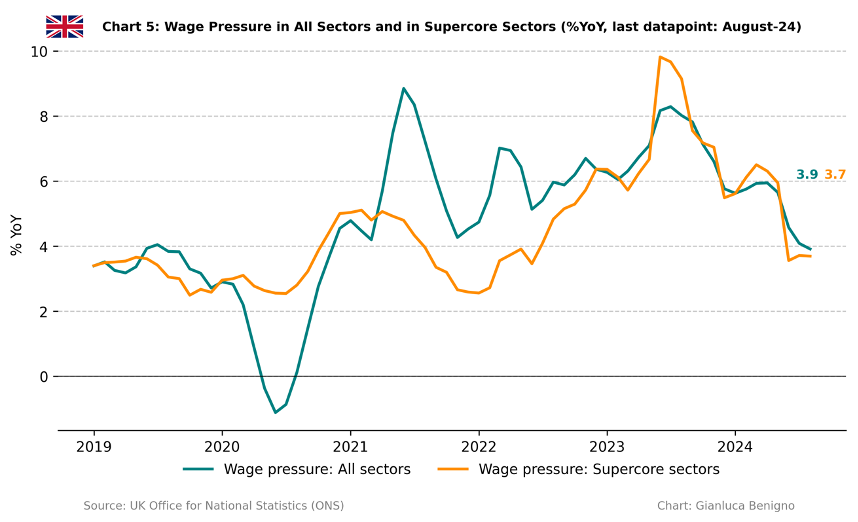
In this context, yesterday featured the release of nominal wage data. Chart 5 highlights our updated supercore wage index, which remained constant at 3.7% YoY in August, unchanged relative to July’s reading. Additionally, overall wages showed a decline in August compared to July, coming in at 3.9% year-on-year versus 4.1% (revised up from 4.0% reported in July’s release).
Policy Implications
With the Bank of England’s decision set for early November, market consensus indicates that the committee will likely lower the policy rate by 25 bps. The current inflation outlook provides support for this policy choice. Notably, the latest inflation data reveals a month-over-month decline in both supercore and service inflation, primarily driven by the transport sector. Upcoming releases will be crucial in determining whether this easing of price pressures will extend to other categories.
Table 1: CPI by components (% YoY)
Source: UK Office of National Statistics (ONS)
Table 2: CPI by components (% MoM)
Source: UK Office of National Statistics (ONS).


