


US December-24 CPI Inflation Report
Core inflation still above 3% but easing slightly relative to previous months


Key takeaways:
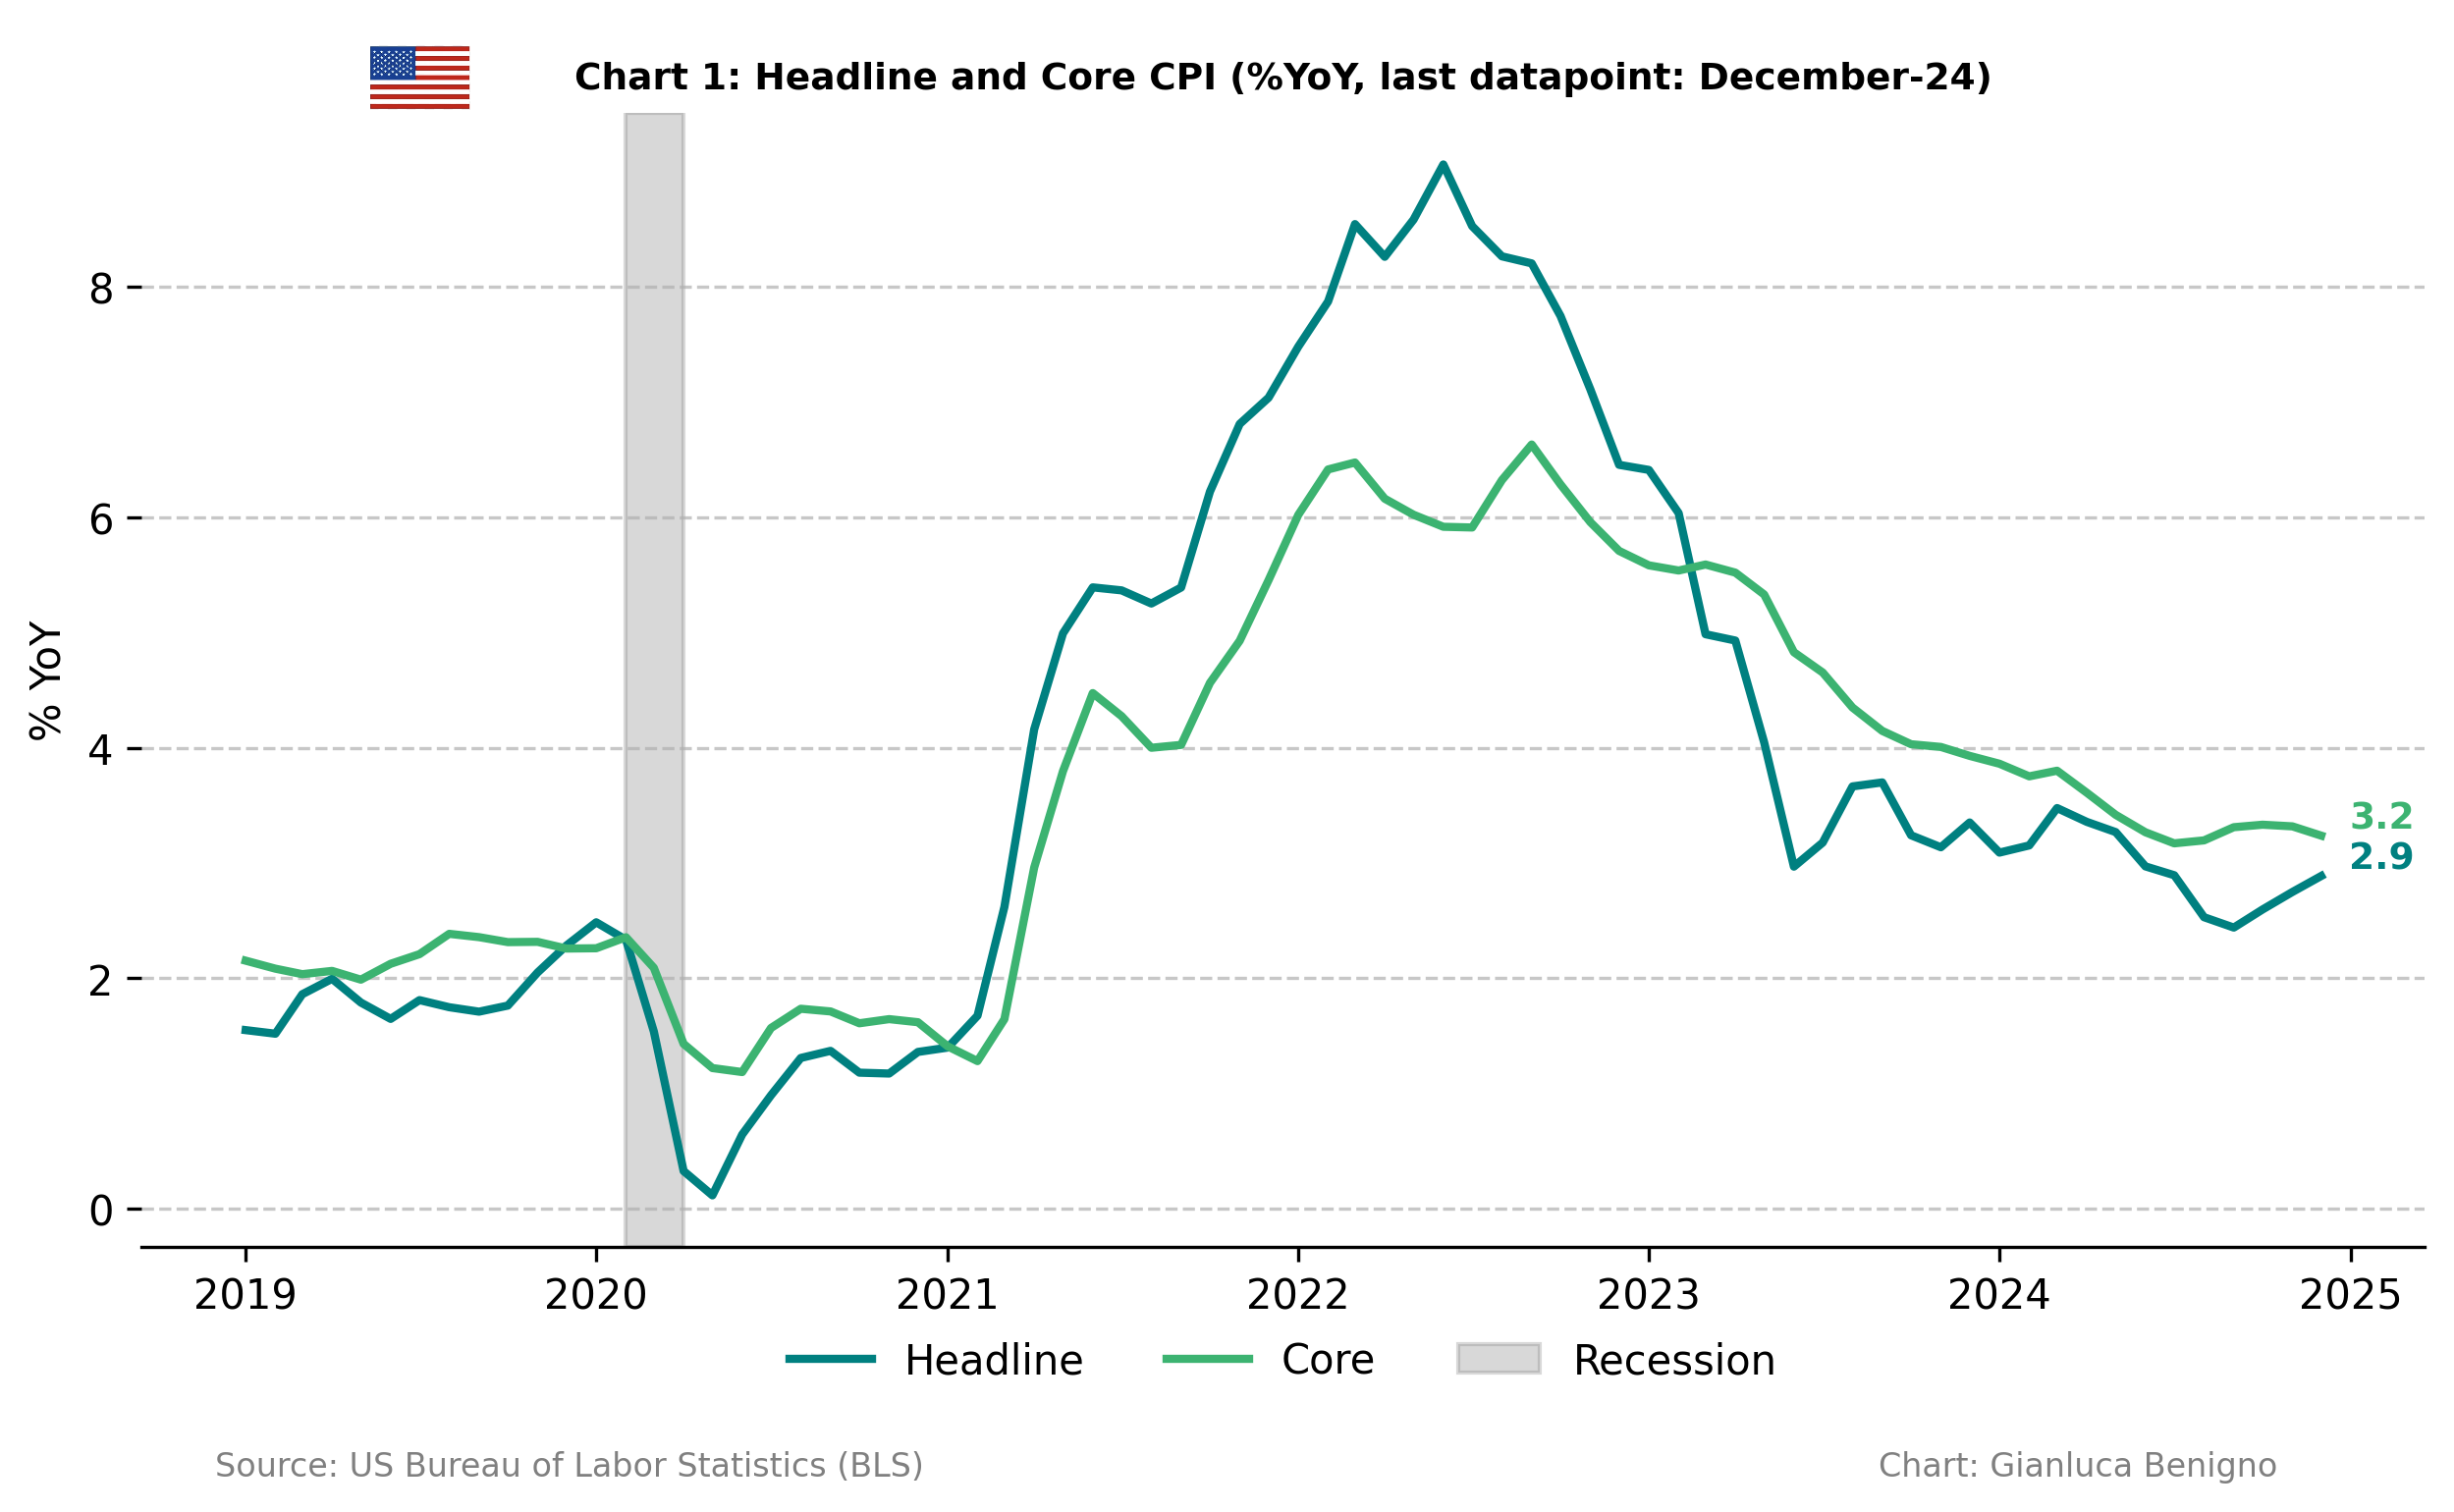
The overall Consumer Price Index (CPI, n.s.a.) increased by 2.9% year-on-year (YoY) (n.s.a) in December, in line with consensus expectation of 2.9% YoY and above the November reading of 2.7% YoY increase.
Core CPI in December was 3.2% YoY (n.s.a.), just below November’s reading and the consensus forecast, both at 3.3% YoY.
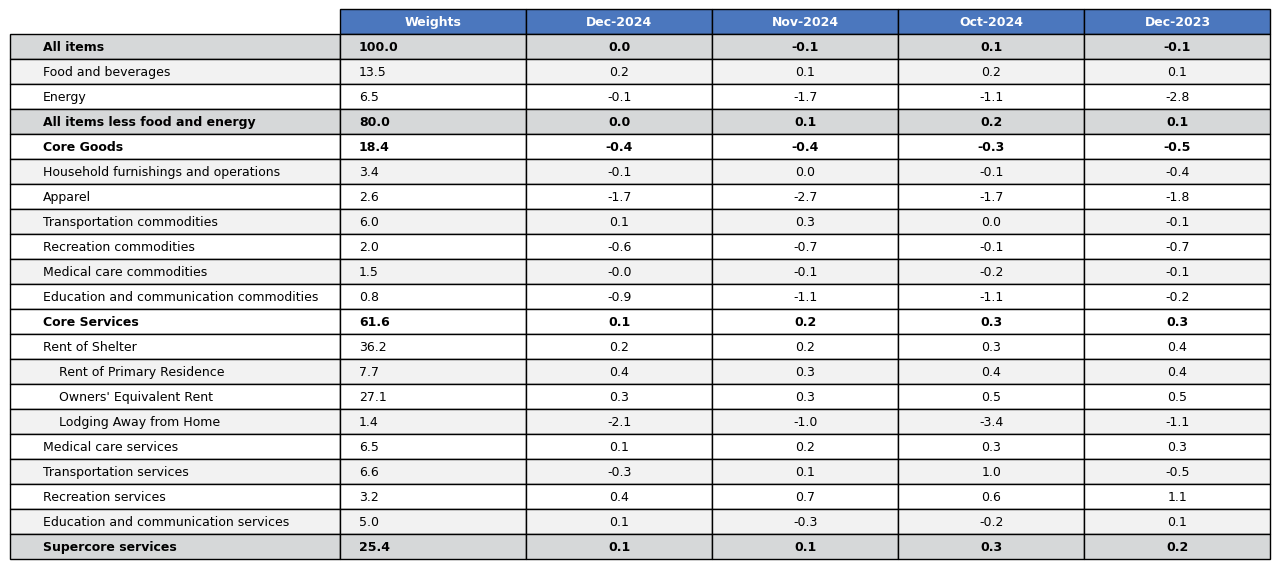
Inflationary pressures are primarily concentrated in the core service sector with an increase of 4.4 % YoY, below the 4.6% YoY observed in November. In contrast, the core goods sector (ex energy and food) is experiencing deflation with a decrease of 0.5% YoY, a lower decrease than the 0.6% YoY recorded in November.
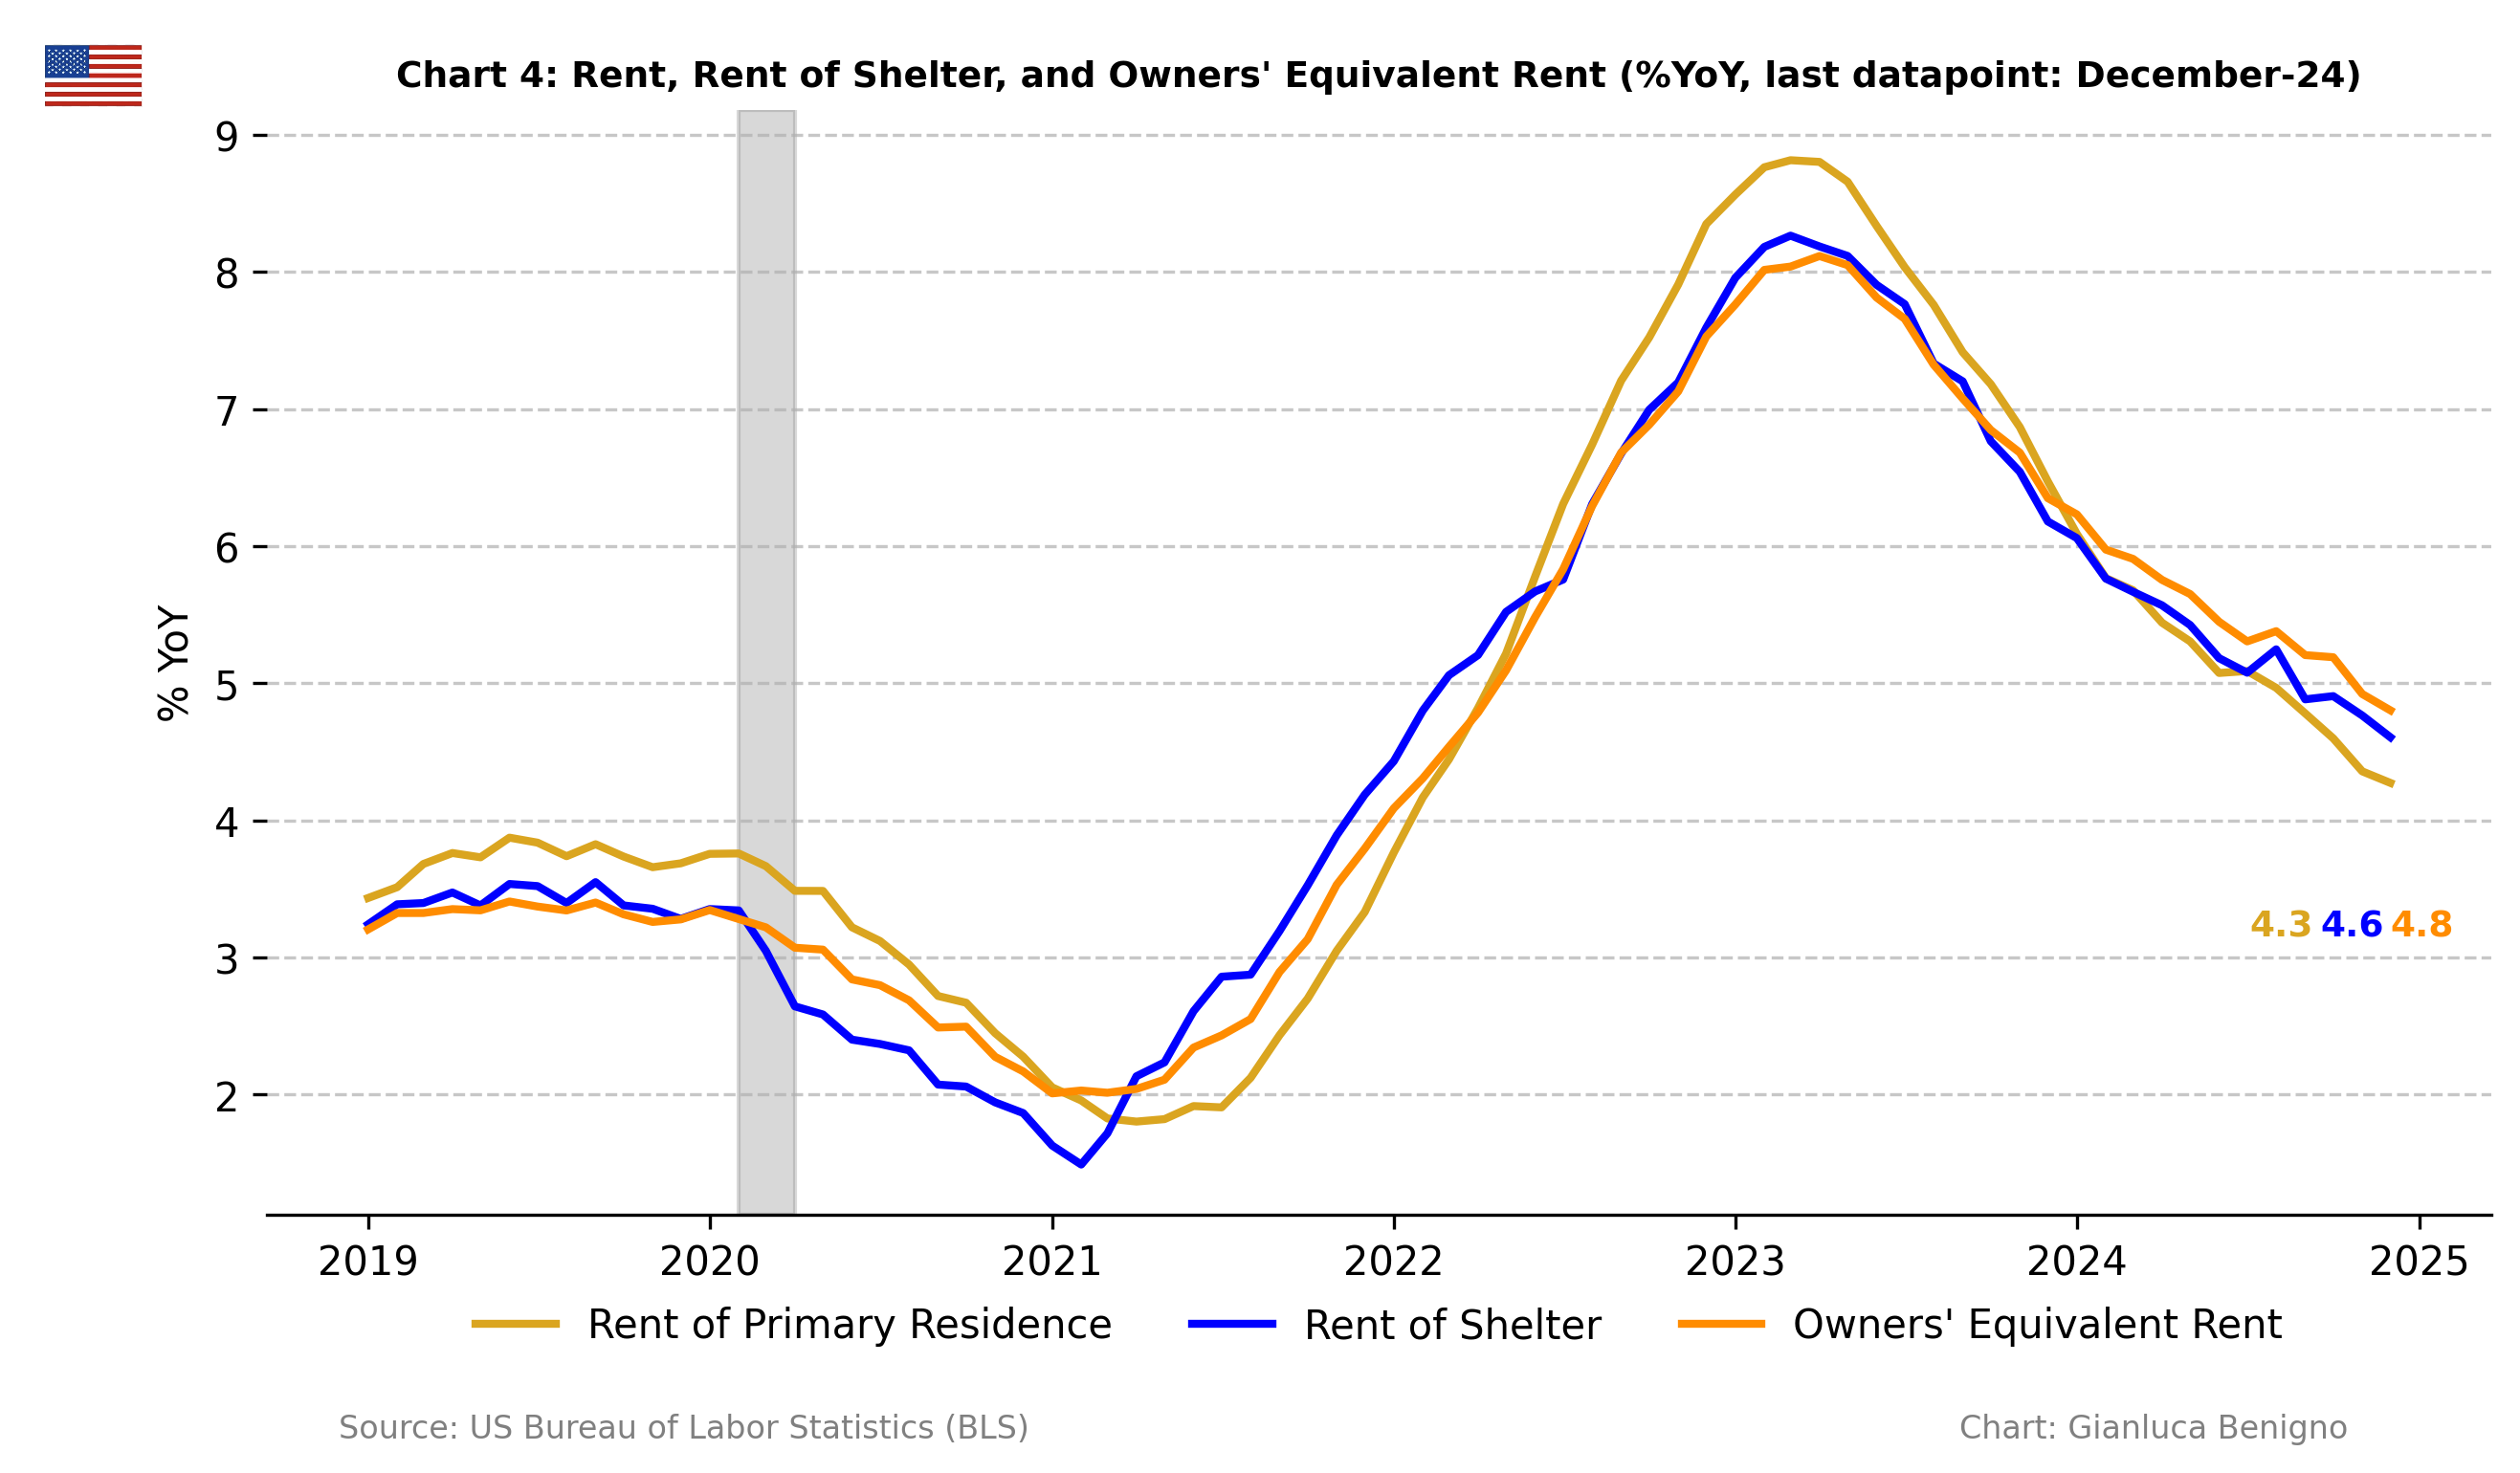
The primary factor behind recent inflationary pressures is still the rent of shelter component of the Consumer Price Index (CPI). Rent of shelter increased by 4.6% YoY in December, lower than the 4.8% YoY recorded in November. The month-on-month increase was 0.2%, the same reading as November.
The current reading is consistent with the very slow pace in the adjustment towards the 2% target. This is due to the persistence of core service inflation and its housing component. It is also interesting to note how core inflation, despite its improvement, has stabilized just above 3% YoY in the past few months. The MoM readings though showed encouraging improvements averaging 0.1% MoM in the last quarter of 2024.
The next FOMC meeting is at the end of January and the Fed fund rate is expected to stay on hold. The first few readings of 2025 might provide some moderation in inflation reading considering the high reading at the beginning of 2024.
Related posts (with links)
U.S. November-24 CPI Inflation Report (previous release)
U.S. October-24 CPI Inflation Report (previous release)
U.S. September-24 CPI Inflation Report (previous release)
US August-24 CPI Inflation Report (previous release)
50 or 25 bps? The cut that could split the Fed (context post);
Post FOMC update: the Fed and the Market Shifts (context post);
Scenario Analysis as Communication Device for Central Banking (related post).
Review of the Inflation Release
The Consumer Price Index (CPI) rose by 2.9% (n.s.a.) year-on-year in December (Chart 1), in line with the market consensus at 2.9% YoY and above November’s figure of 2.7% YoY. On a month-on-month basis, there was no change, just above the 0.1% MoM decline in November’.
Core CPI (excluding food and energy) increased by 3.2% year-on-year (Chart 1) in December, just below market consensus and November’s figure, both at 3.3% YoY. On a month-on-month basis, core CPI also showed no change, lower than the 0.1% increase recorded in November.
Core services (services excluding energy) remain the primary driver of inflationary pressures. In December, core services increased by 4.4% YoY (below the 4.6% YoY recorded in November), while core goods (goods excluding food and energy) remained in deflationary territory, experiencing in December another decrease, this time of 0.5% YoY (a lower decline than the 0.6% YoY decline recorded in November). The current release confirms that core CPI inflation is moderating at a very slow pace, largely due to the gradual adjustment of core services.
The following chart (Chart 2) illustrates this dichotomy between core goods and core services seen in many advanced countries (except for Japan), including the US:

The CPI in December was once more primarily driven by the housing component (Tables 1 and 2). The rent of shelter component rose by 4.6% year-on-year in December, lower than the 4.8% YoY recorded in November. Noticeably, the shelter component increased by 0.2% on a month-on-month basis, the same rate as in November.
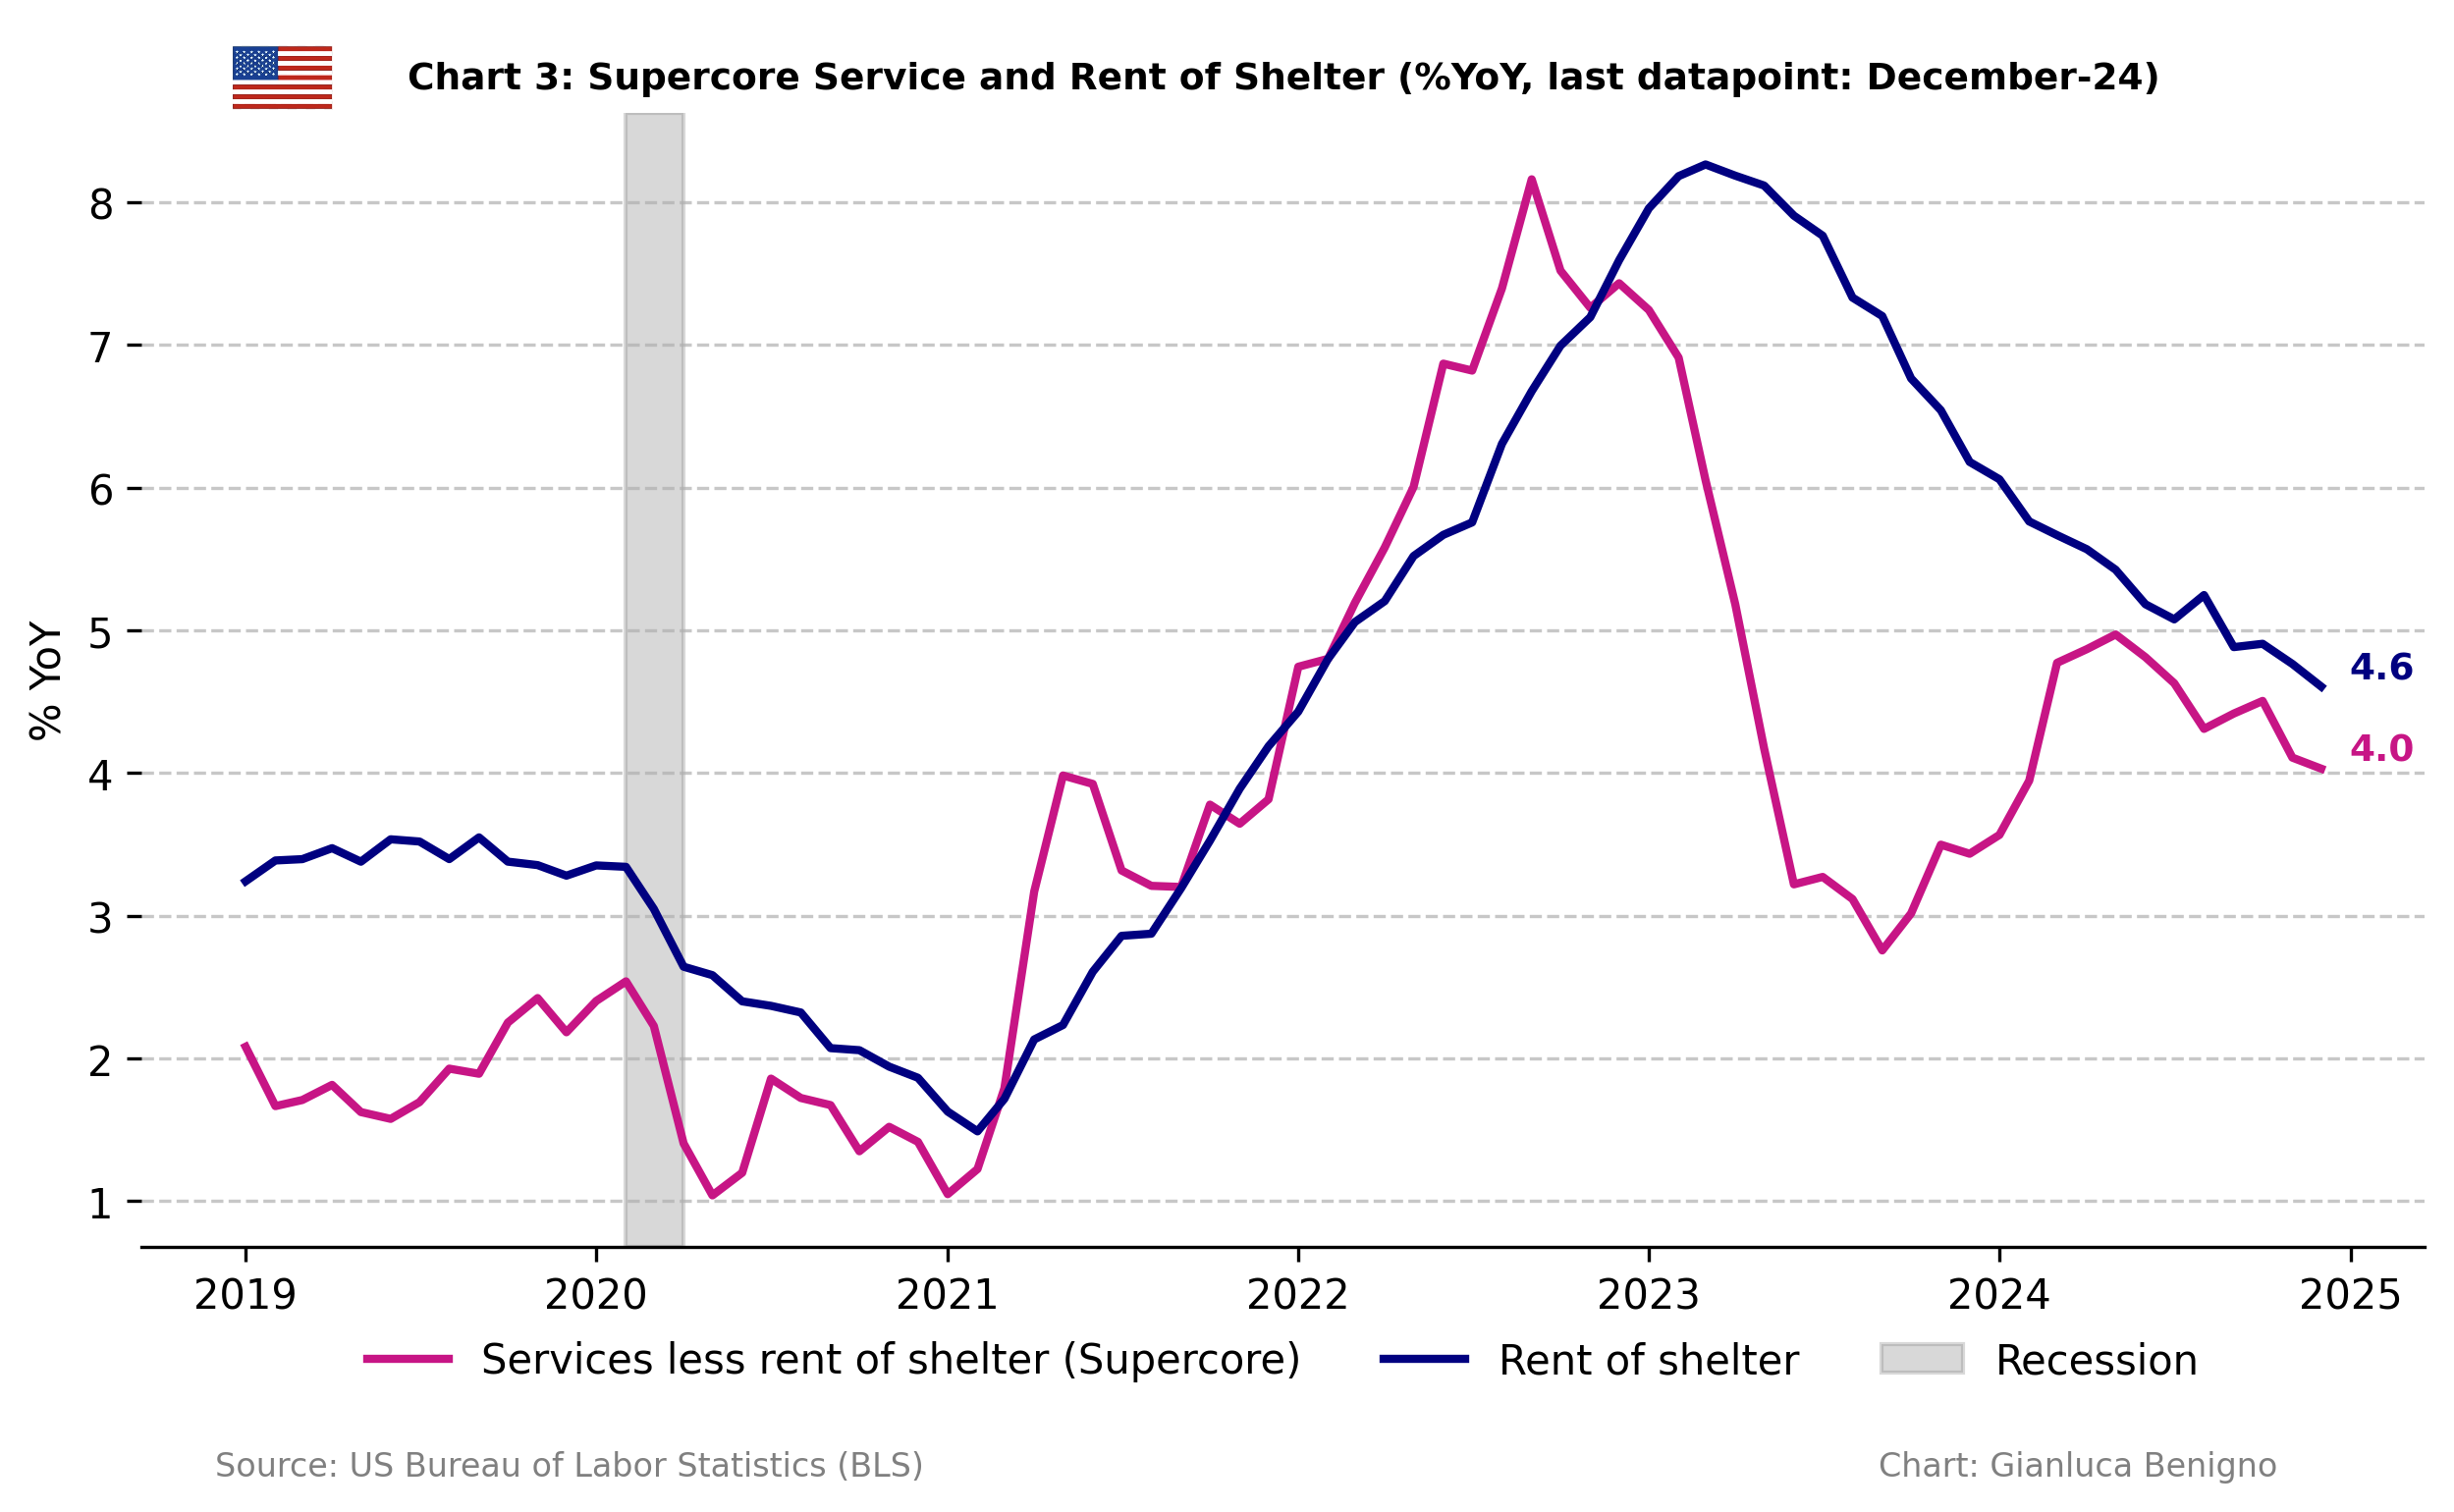
Within this context, supercore services (core services excluding shelter – Chart 3) increased by 4% year-on-year, below the 4.1% increase in November. On a monthly basis, the supercore component has increased by 0.1% MoM, the same rate as in November.
The Bureau also published the Harmonized Index of Consumer Prices (HICP), following the ECB’s methodology. According to the BLS: “The HICP differs from the U.S. Consumer Price Index (CPI) in two major respects. First, the HICP includes the rural population in its scope. Second, and probably more importantly, the HICP excludes owner-occupied housing”.
Chart 5 reveals that by excluding the owner-occupier rent component from the CPI, the inflation rate has ticked higher, at 2.6% in December compared to 2.3% (n.s.a.) year-on-year in November 2024.

Summary
The trajectory of inflation till September 2024 reinforced the Fed’s confidence in its disinflationary pattern towards the 2% target. For this reason, along with concern about the labor market, the FOMC started the easing cycle in September 2024 and continued it with a 25bps cut in November and December.
As the labor market showed resiliency, the focus of the FOMC has shifted again towards inflation: indeed, recent releases indicated that core inflation has plateaued, stabilizing around 3%. Core services’ inflation remains elevated above 4%, driven primarily by persistent housing costs.
The latest SEP projection suggests a slow easing cycle in 2025: the median FOMC participant projects two rate cuts in 2025. Current market pricing is more hawkish pricing less than two rate cuts.
Overall, a more gradual approach to the easing cycle is warranted. Inflation releases at the beginning of 2025 might ease some concern as base effects from higher inflation readings of the first quarter of 2024 will kick in but on the other hand, several sources of uncertainties might shape the behavior of inflation well into 2025.
Table 1: CPI by components (% YoY)

Source: Bureau of Labor Statistics (BLS).
Table 2: CPI by components (% MoM)
Source: Bureau of Labor Statistics (BLS)