


US January-25 CPI Inflation report
An unexpected rise in inflation will likely dampen expectations for rate cuts, reinforcing the Fed's cautious stance and increasing the likelihood of a prolonged higher-for-longer rate environment.

Key takeaways:
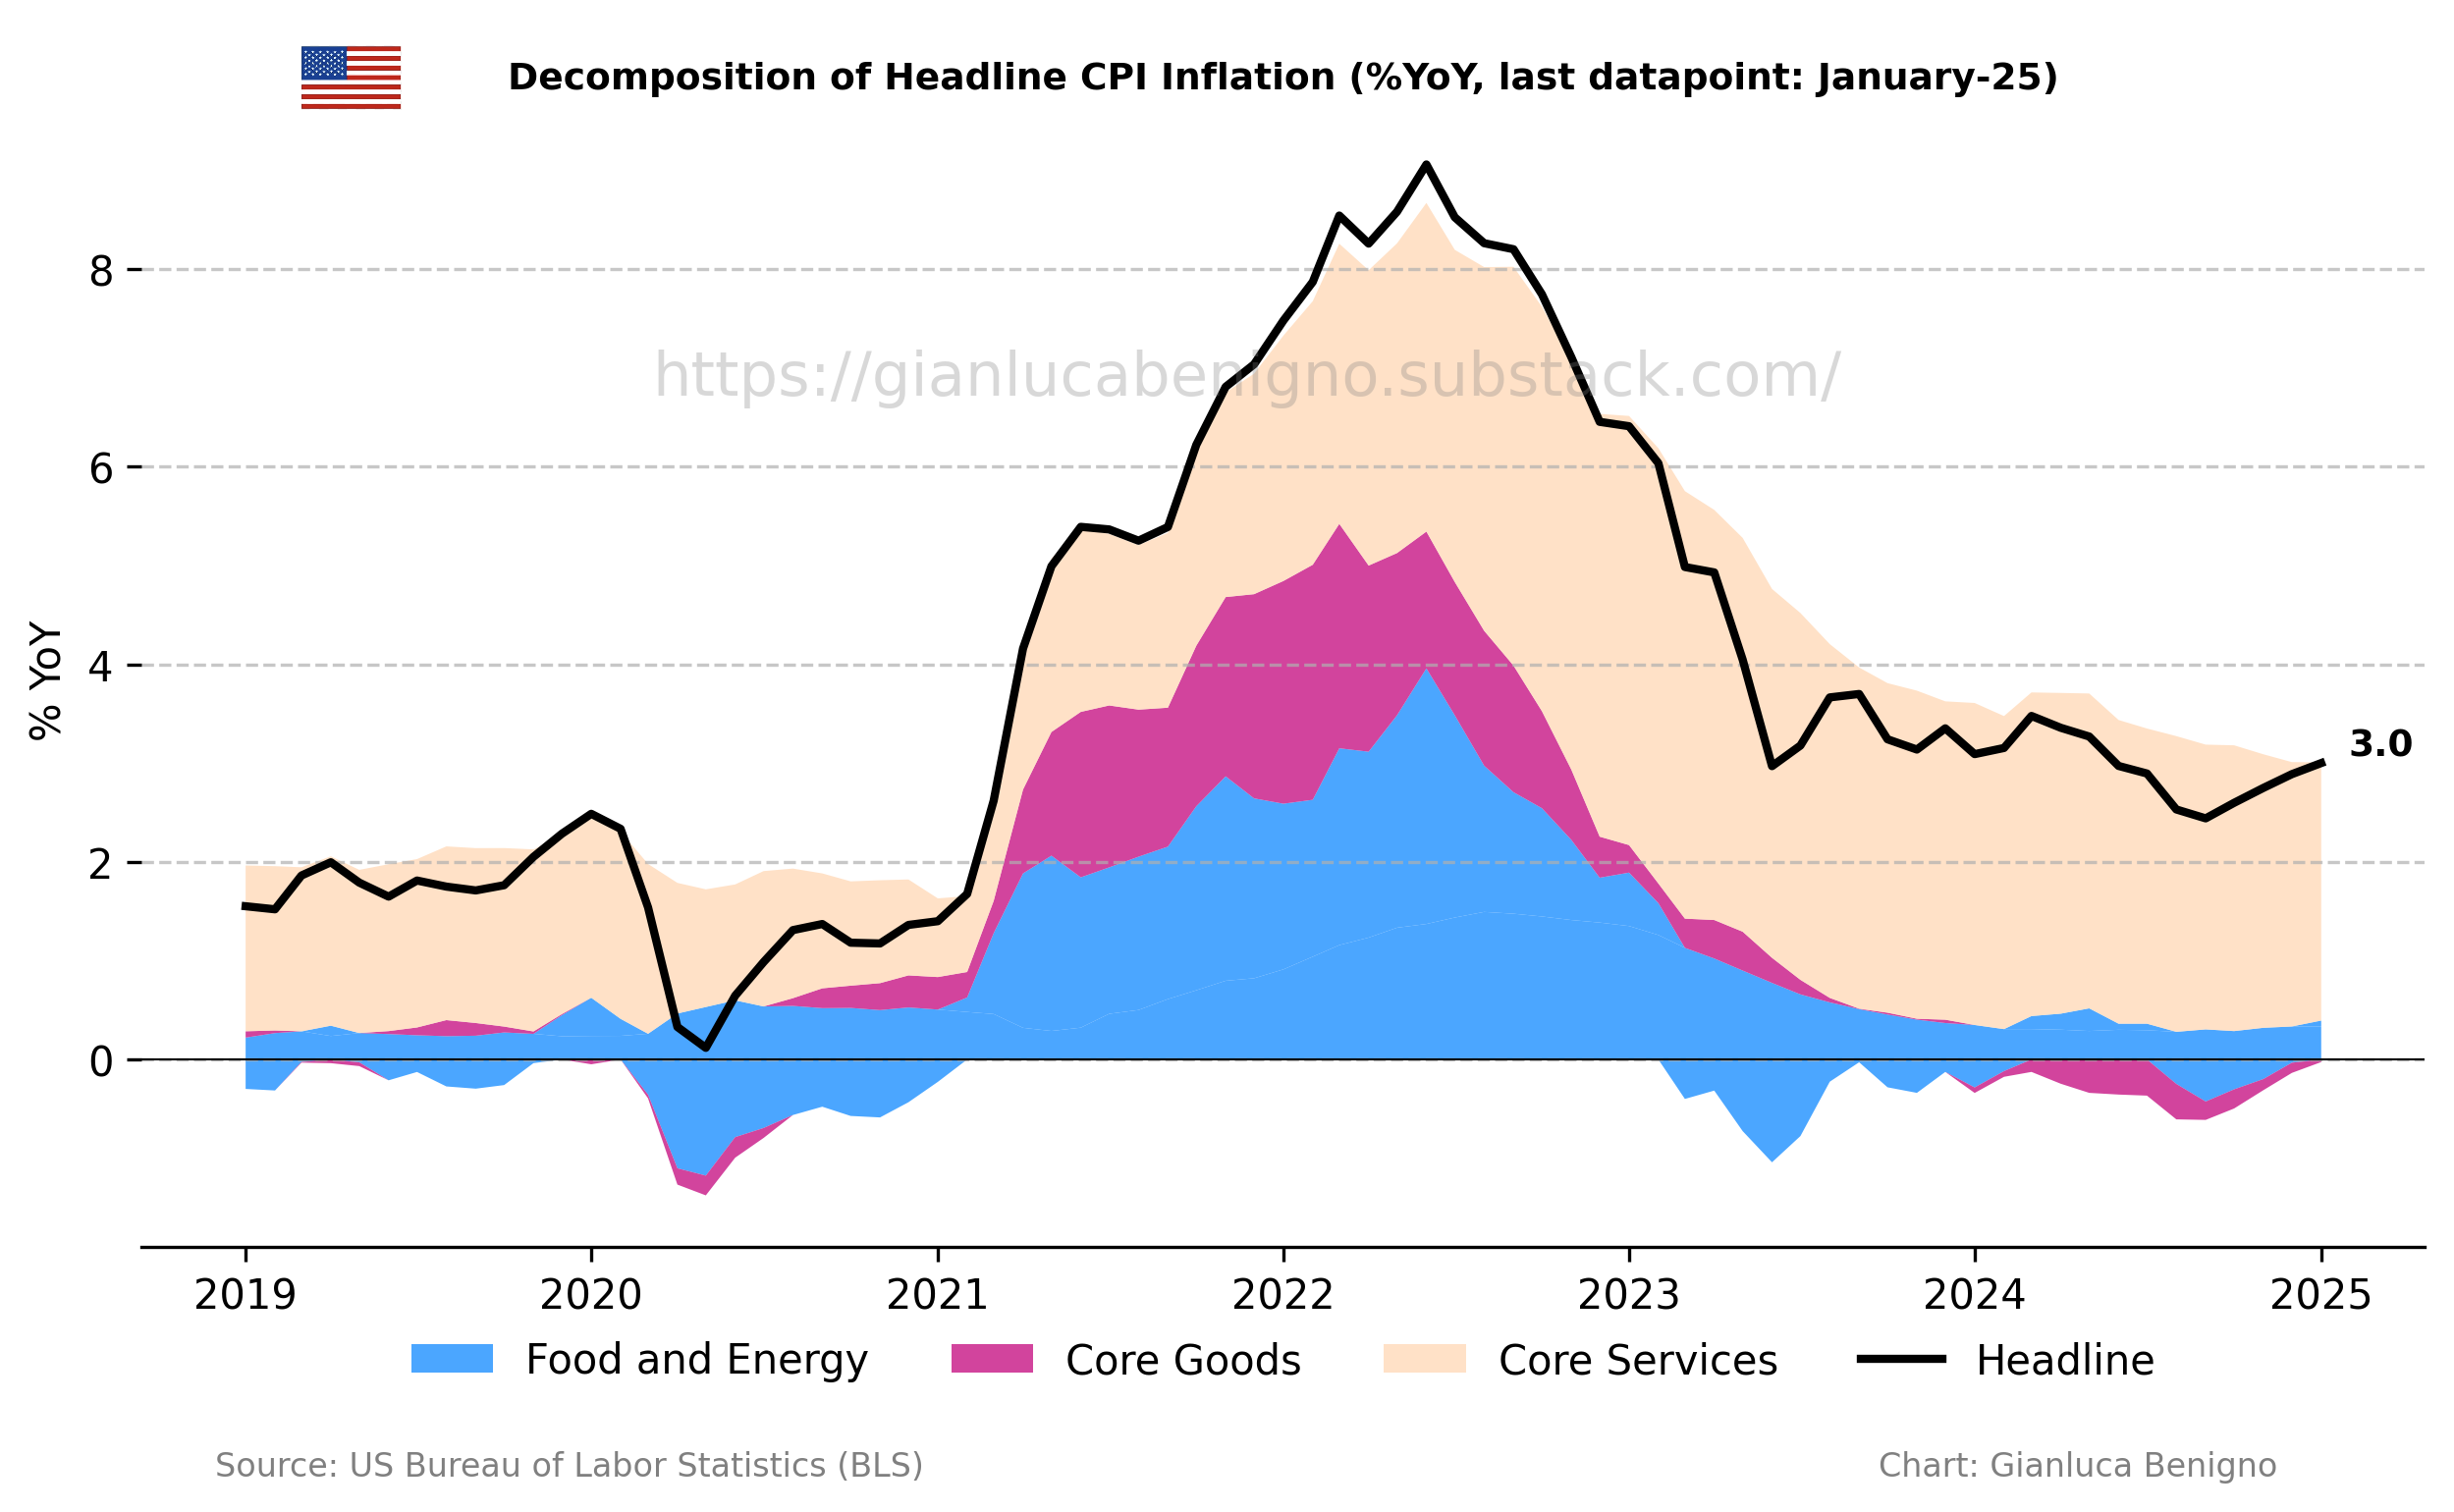
The overall Consumer Price Index (CPI, n.s.a.) increased by 3.0% year-on-year (YoY) in January, above the consensus expectation, and the December reading, both at 2.9% YoY.
Core CPI in January was 3.3% YoY (n.s.a.), just above December’s reading of 3.2% YoY and the consensus forecast at 3.1% YoY.
Inflationary pressures are primarily concentrated in the core service sector with an increase of 4.3 % YoY, below the 4.4% YoY observed in December. In contrast, the core goods sector (ex-energy and food) is experiencing deflation with a decrease of 0.1% YoY, a lower decrease than the 0.5% YoY recorded in December.
The primary factor behind recent inflationary pressures is still the rent of shelter component of the Consumer Price Index (CPI). Rent of shelter increased by 4.4% YoY in January, lower than the 4.6% YoY recorded in December. The month-on-month increase was 0.5% (n.s.a.), vs 0.2% in December.
The slow adjustment of core service inflation and its housing component are the key factors behind the lack of adjustment towards the 2% target. It is also interesting to note how core inflation seems to have stabilized above 3% YoY in the past few months. The MoM readings showed encouraging improvements averaging 0.1% MoM in the last quarter of 2024 but jumped to 0.6%MoM (n.s.a.) in January.
The next FOMC meeting is scheduled for March 18-19, and the Fed is expected to keep the funds rate unchanged. The latest data, along with recent releases, reinforces the market’s hawkish outlook, suggesting that rate cuts may be postponed even further into 2025.
Related posts (with links)
U.S. December-24 CPI Inflation Report (previous release)
U.S. November-24 CPI Inflation Report (previous release)
U.S. October-24 CPI Inflation Report (previous release)
U.S. September-24 CPI Inflation Report (previous release)
US August-24 CPI Inflation Report (previous release)
Scenario Analysis as Communication Device for Central Banking (related post).
Interest Rate Politics: Can Trump Pressure the Fed? (related post).
Review of the Inflation Release
The Consumer Price Index (CPI) rose by 3.0% (n.s.a.) year-on-year in January (Chart 1), above the market consensus at 2.9% YoY and December’s figure of 2.9% YoY. On a month-on-month basis, CPI increased by 0.7% MoM (n.s.a.), much higher than the no change (0% MoM) in December. On a seasonally adjusted basis, the increase was still significant at 0.5% MoM.
Core CPI (excluding food and energy) increased by 3.3% year-on-year (Chart 1) in January, above market consensus at 3.1% YoY and December’s figure, at 3.2% YoY. On a month-on-month basis, core CPI increased by 0.6% MoM (n.s.a.), higher than the no change (0% MoM) recorded in December. On a seasonally adjusted basis, the increase was also significant at 0.4% MoM.

Core services (services excluding energy) remain the primary driver of inflationary pressures. In January, core services increased by 4.3% YoY (below the 4.4% YoY recorded in December), while core goods (goods excluding food and energy) remained in deflationary territory, experiencing in January another decrease, this time of 0.1% YoY (a lower decline than the 0.5% YoY decline recorded in December). The current release confirms that core CPI inflation is stable above 3%, largely due to the very slow adjustment of core services.
The following chart (Chart 2) illustrates this contrast between core goods and core services, common to many advanced countries (except for Japan):

The CPI in January was primarily driven by the housing component (Tables 1 and 2). The rent of shelter components rose by 4.4% year-on-year in January, lower than the 4.6% YoY recorded in December. Noticeably, the shelter component increased by 0.5% on a month-on-month basis (n.s.a.) vs 0.2% MoM in December.
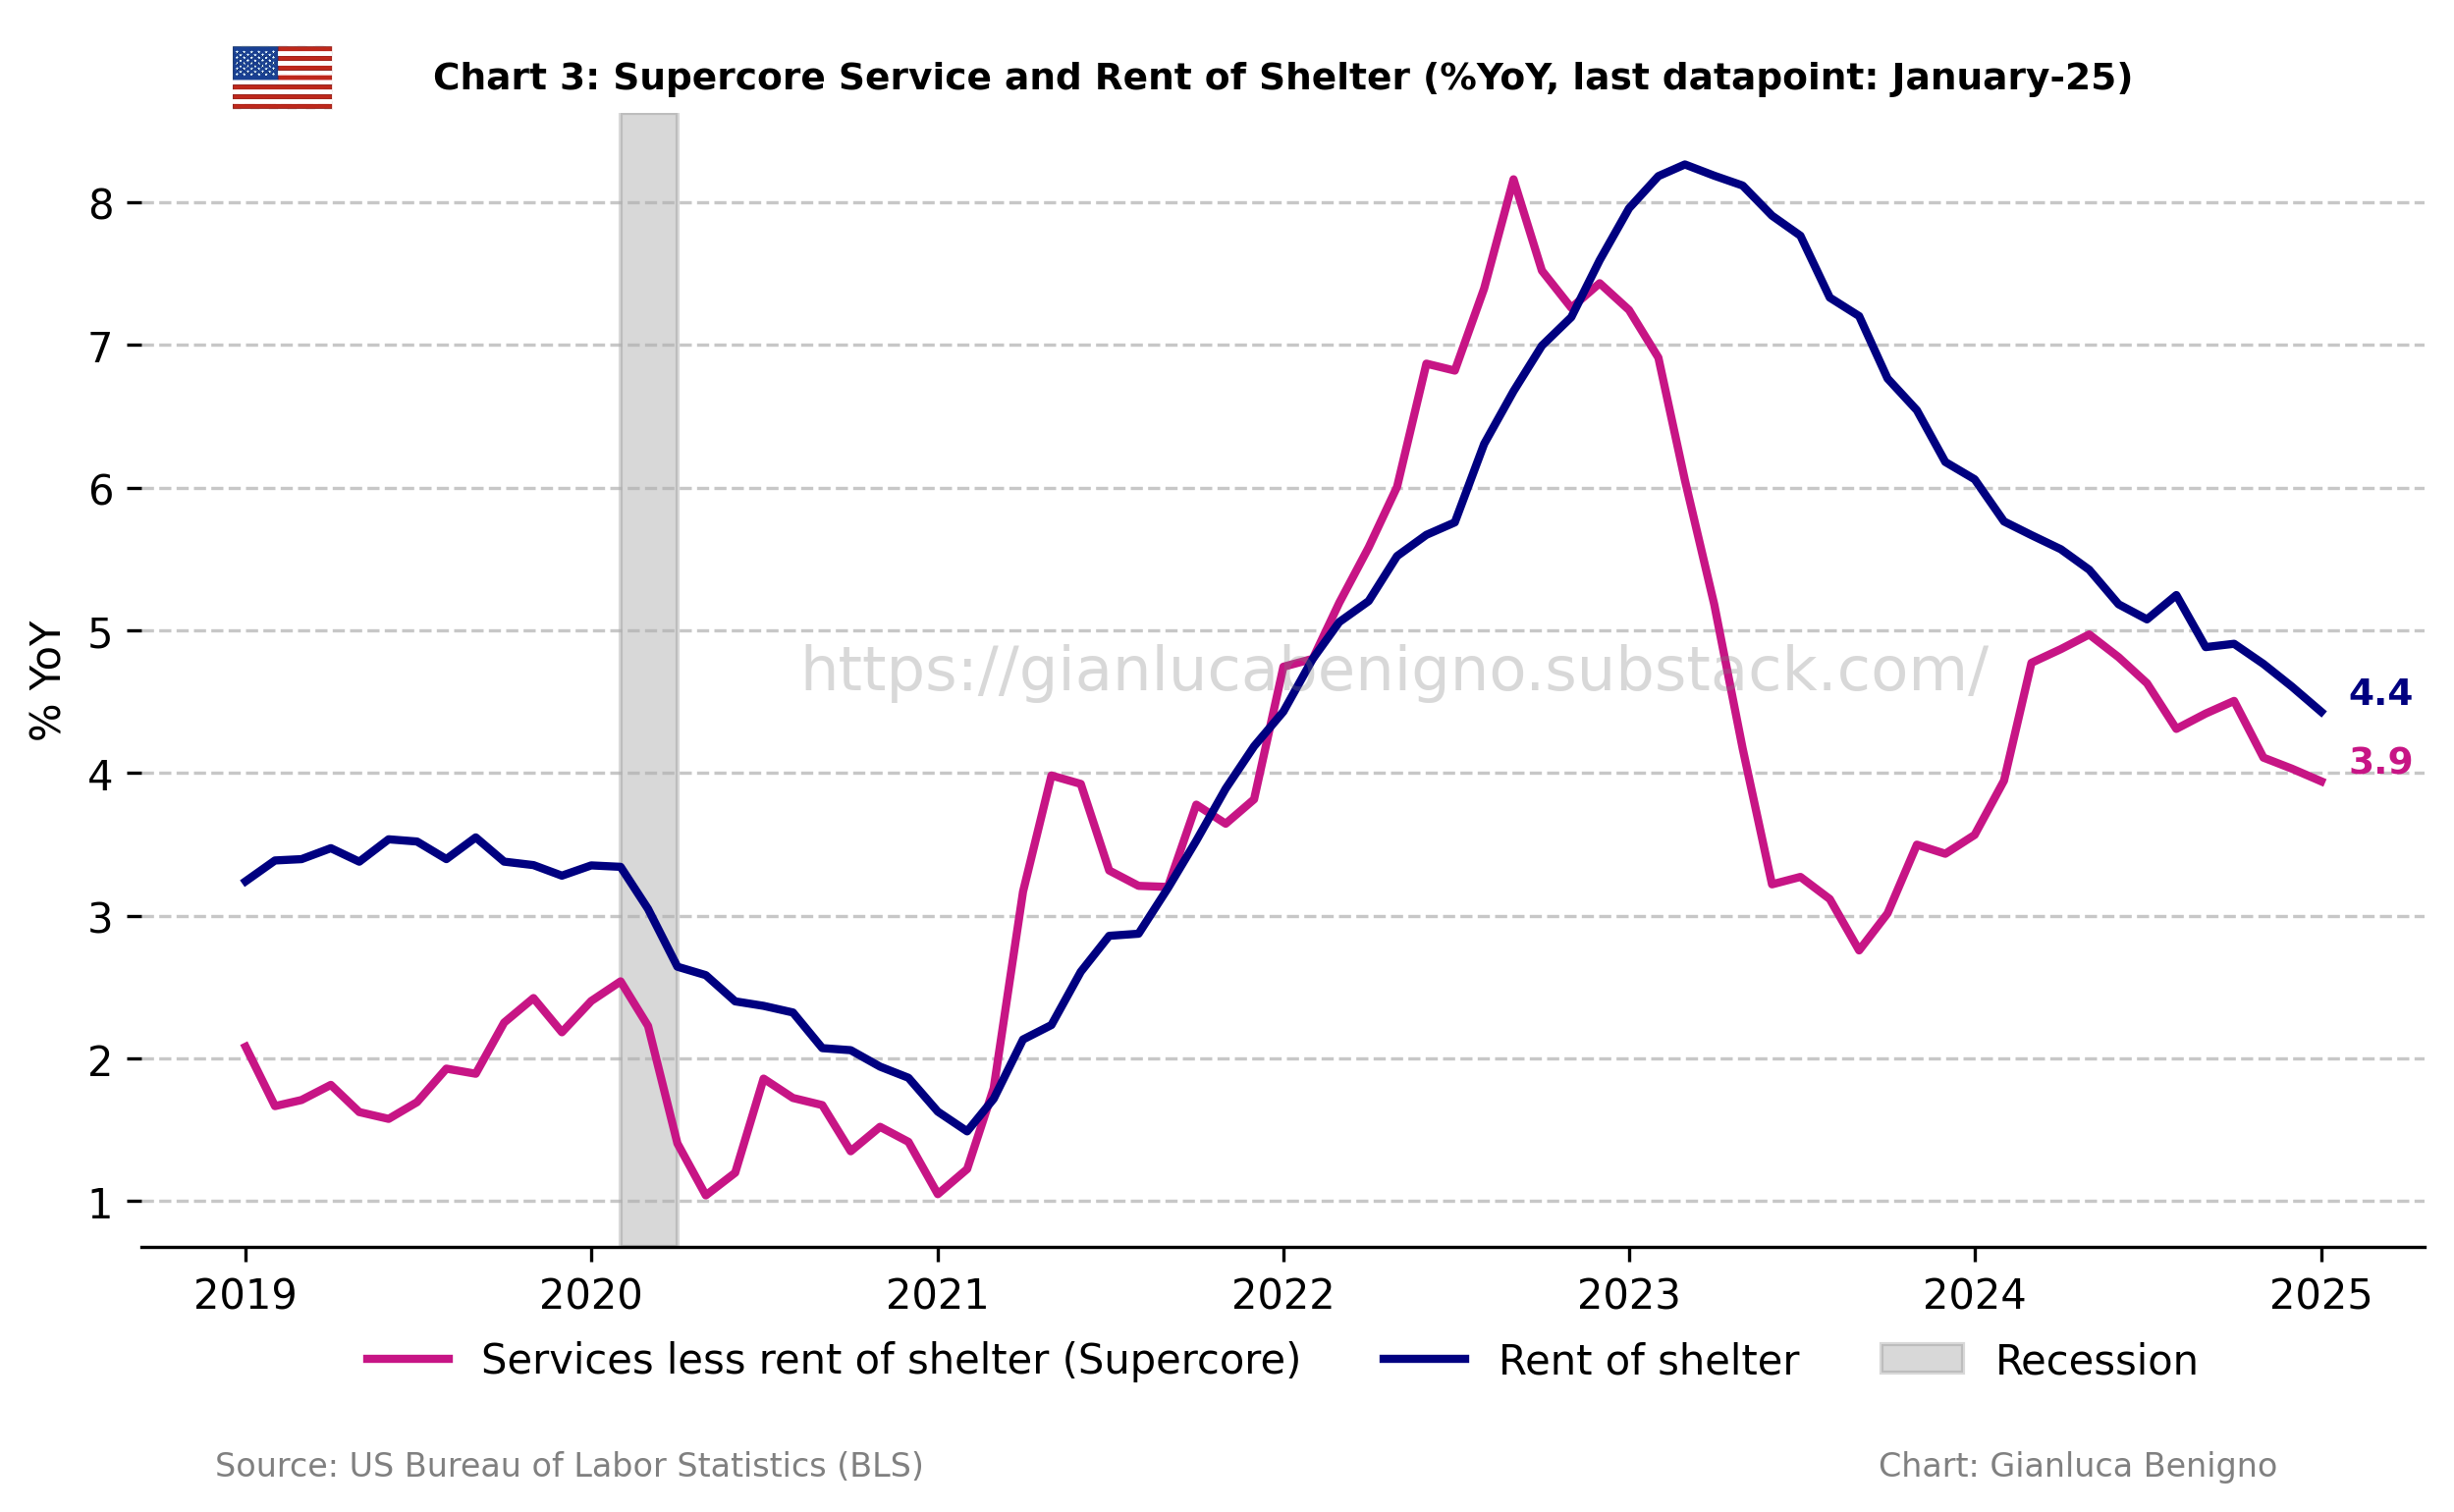
Within this context, supercore services (core services excluding shelter – Chart 3) increased by 3.9% year-on-year vs the 4.0% increase in December. On a monthly basis, the supercore component increased by 0.8% MoM in January, significantly higher than the 0.1% MoM increase in December.

Summary
The beginning of the easing cycle since September 2024, has coincided with a slowdown in the disinflationary progress towards the 2% target.
The primary concern for monetary policymakers is the sluggish adjustment of core inflation, which has remained stable at just above 3% in the final months of 2024. Core services inflation continues to hover above 4%, largely driven by persistent housing costs.
The latest Summary of Economic Projections (SEP) suggests a gradual easing cycle in 2025, with the median FOMC participant expecting two rate cuts. However, market pricing remains more hawkish, reflecting expectations of only one rate cut for the year.
Recent inflation data has further reinforced this outlook, showing that core inflation remains stuck above 3%. A key factor contributing to this persistence appears to be the asymmetric pace of adjustment between goods and services prices. While goods prices are stabilizing more quickly after a period of deflationary pressure, services prices are adjusting more slowly toward the 2% target. This divergence is likely playing a critical role in keeping core inflation elevated.
This current release further reinforces the hawkish market pricing, postponing the rate cut later in the year. It would be interesting to see if the market will start pricing a rate hike as well.
Table 1: CPI by components (% YoY)
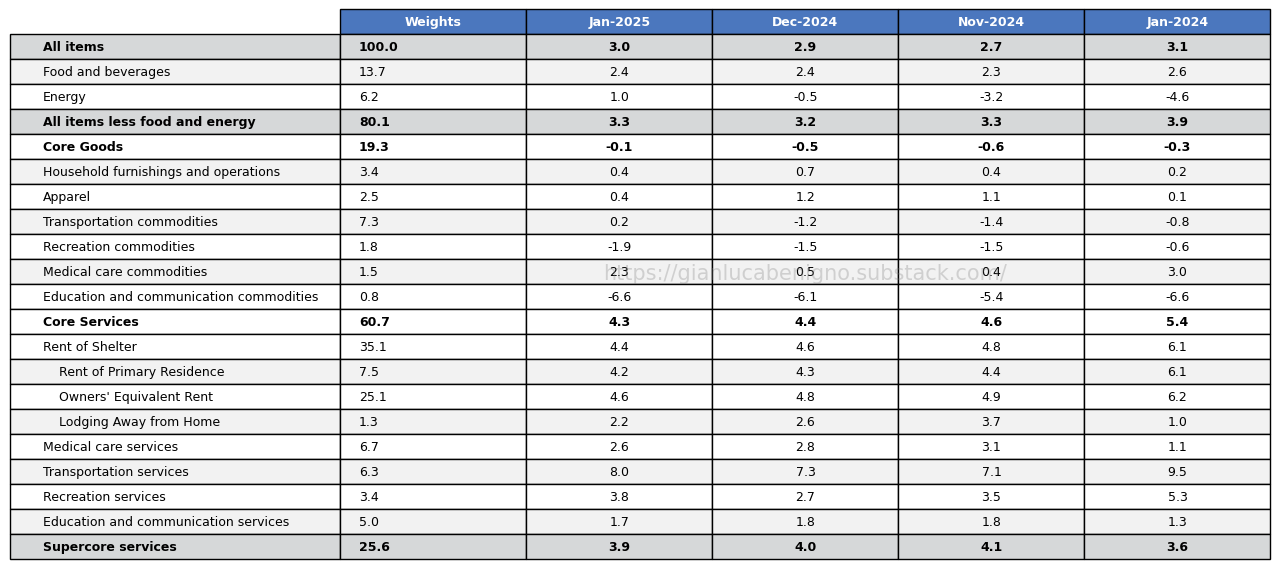
Source: Bureau of Labor Statistics (BLS).
Table 2: CPI by components (% MoM)

Source: Bureau of Labor Statistics (BLS)