


US March-25 CPI Inflation Report
Better than expected inflation data both at the headline and core levels. Coreservice inflation also improving significantly.

Key takeaways:
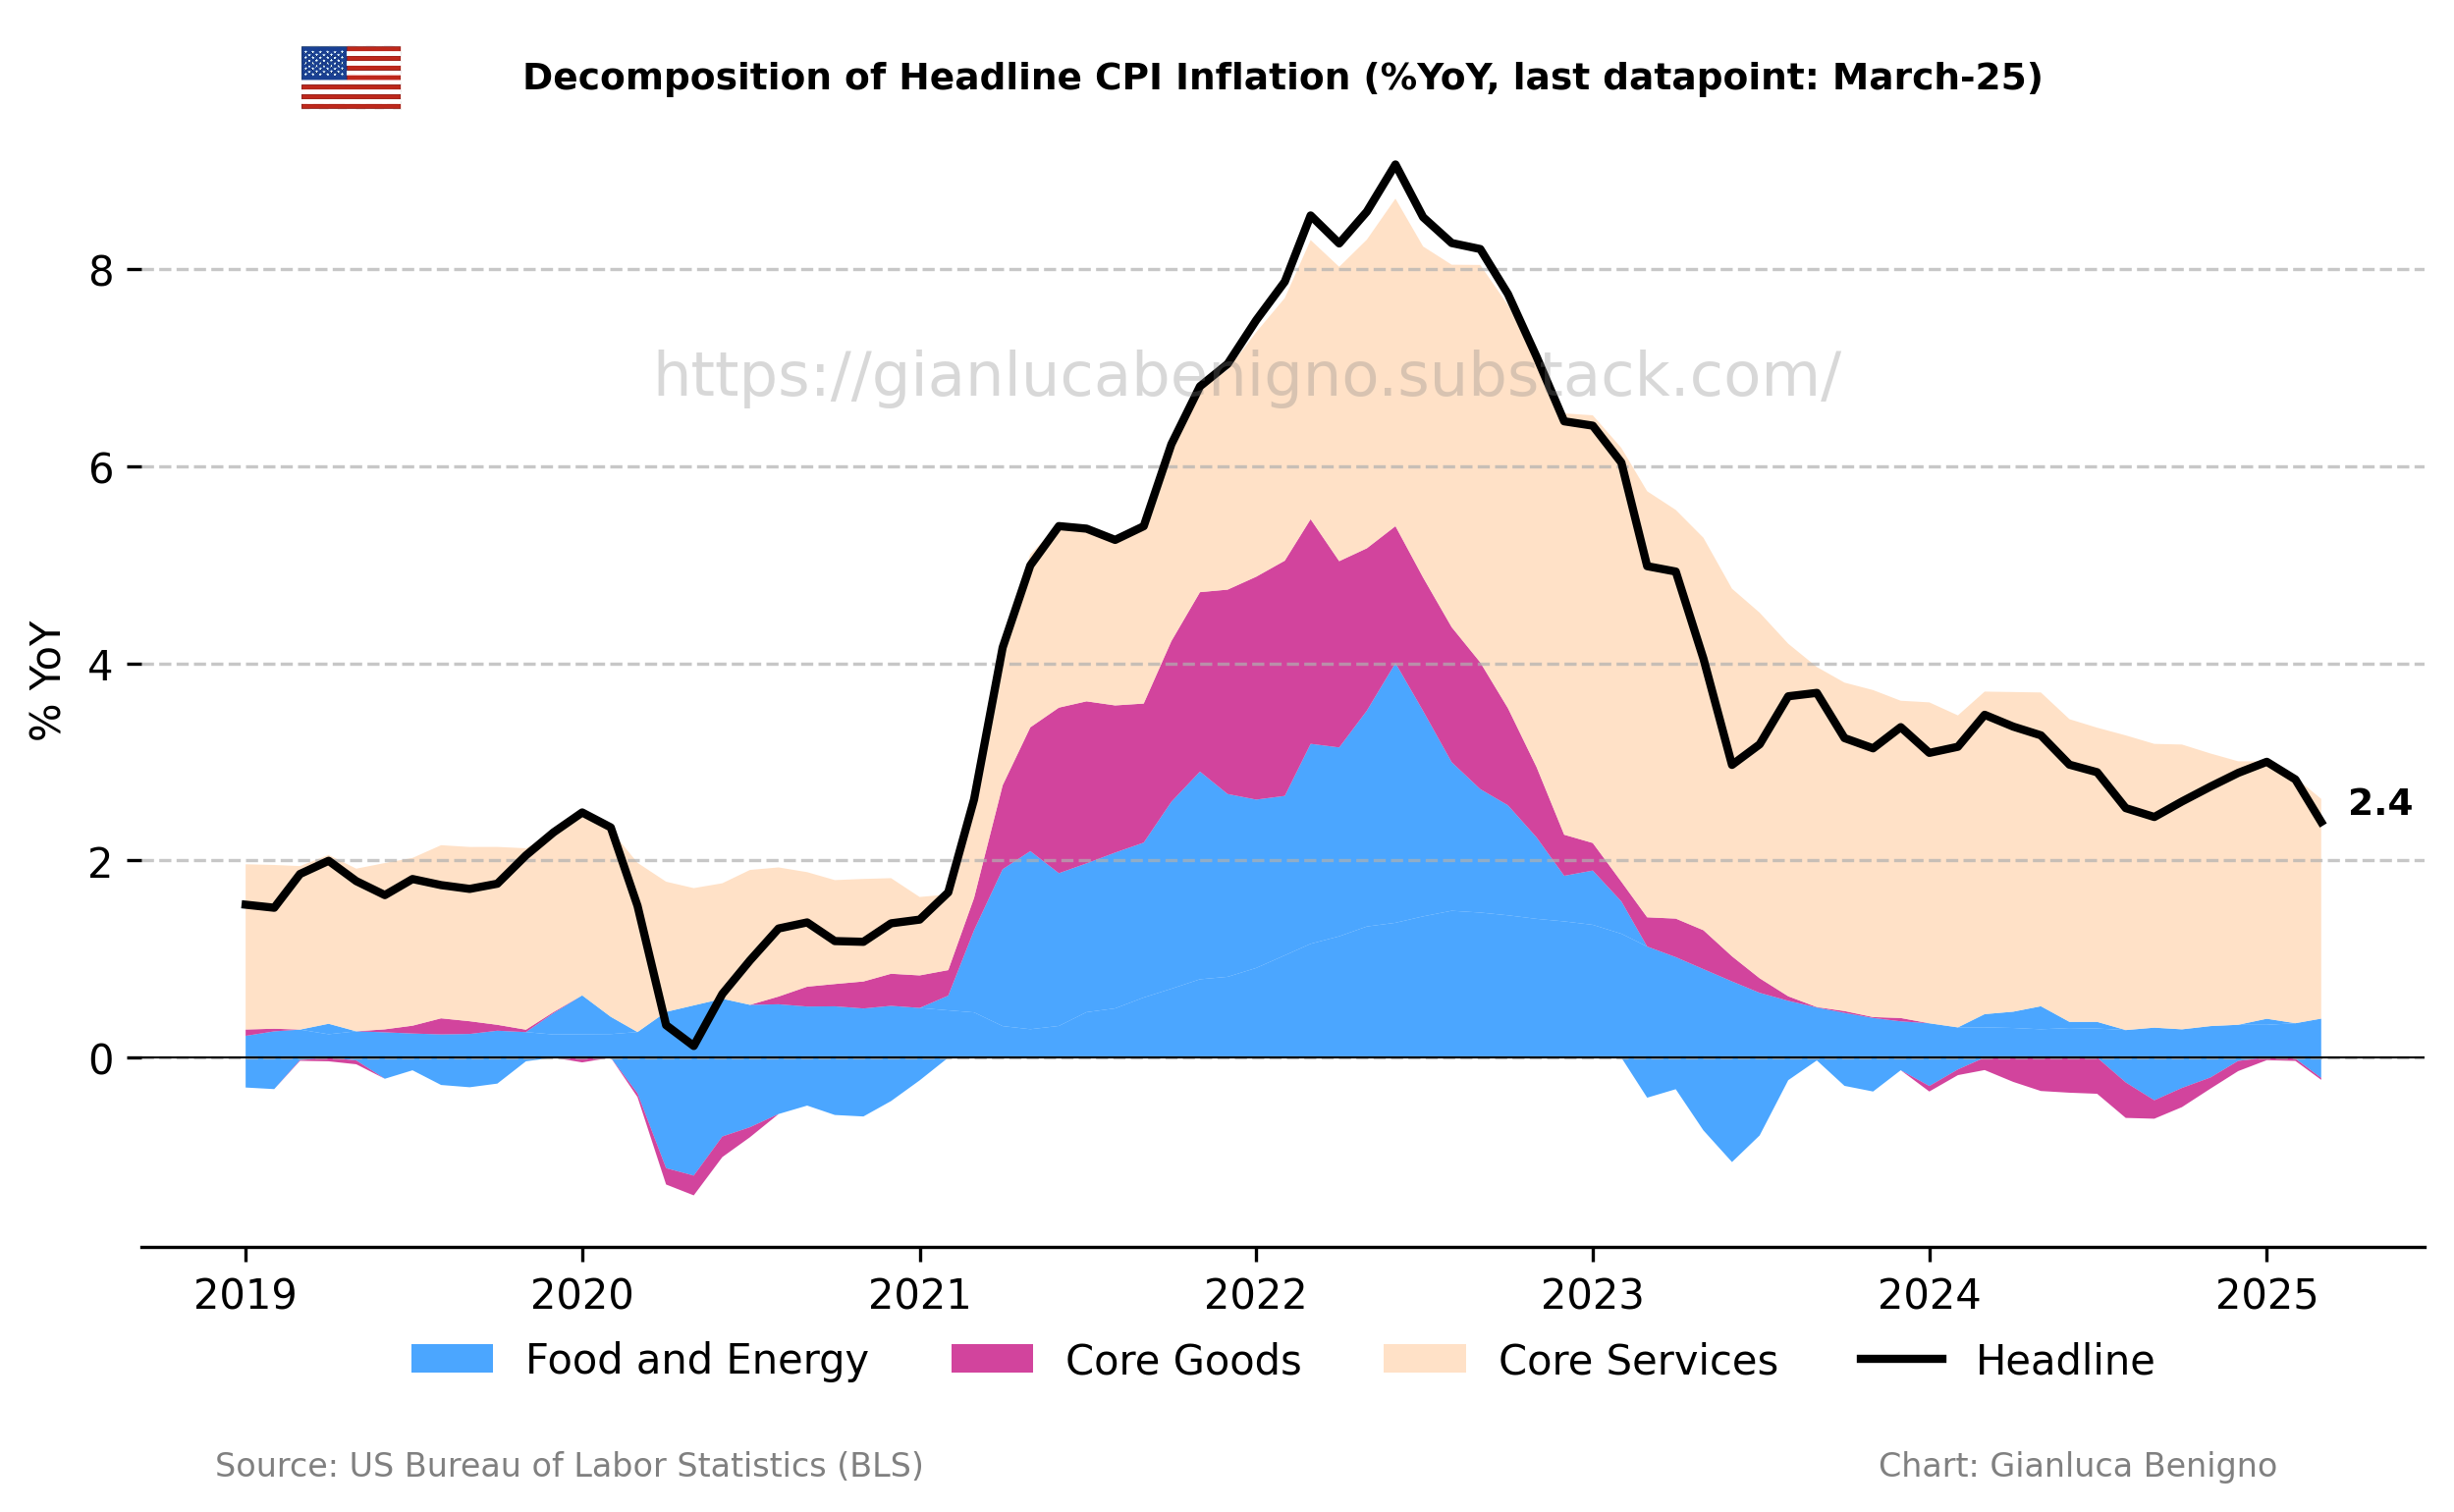
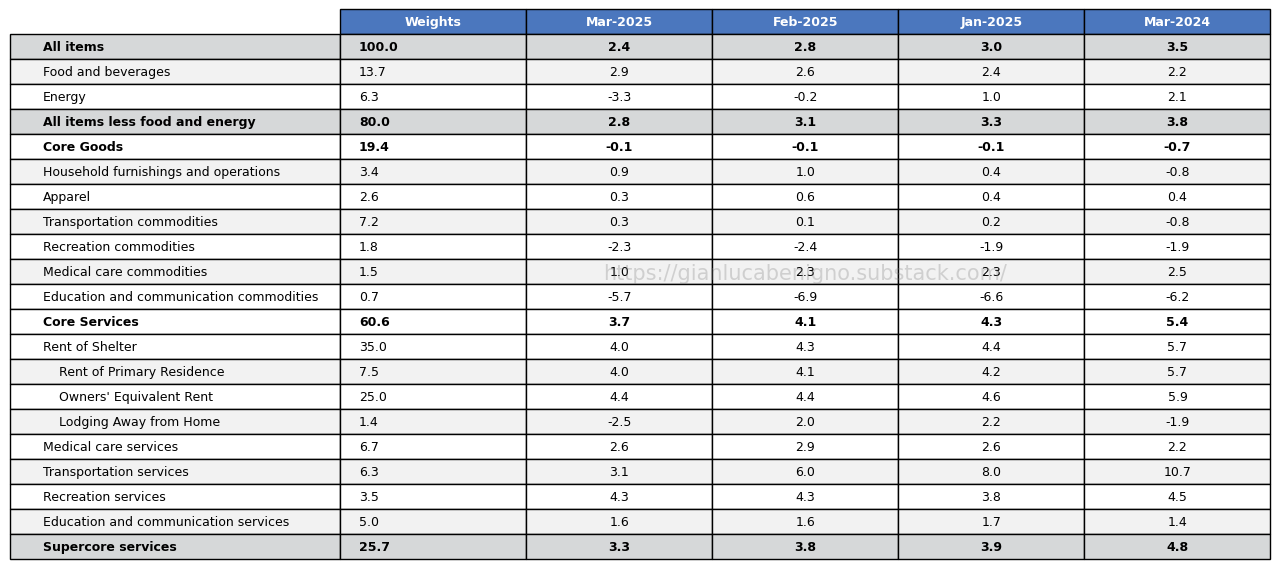
The overall Consumer Price Index (CPI, n.s.a.) increased by 2.4% year-on-year (YoY) in March, lower than the consensus expectation of 2.5 % YoY and below February’s reading of 2.8% YoY.
Core CPI in March was 2.8% YoY (n.s.a.), below February’s reading of 3.1% YoY and the consensus forecast of 3.0% YoY.
Inflationary pressures are primarily concentrated in the core service sector, with an increase of 3.7 % YoY in March, below the 4.1% YoY observed in February. In contrast, the core goods sector (ex-energy and food) is experiencing deflation with a decrease of 0.1% YoY, the same decrease as in February.
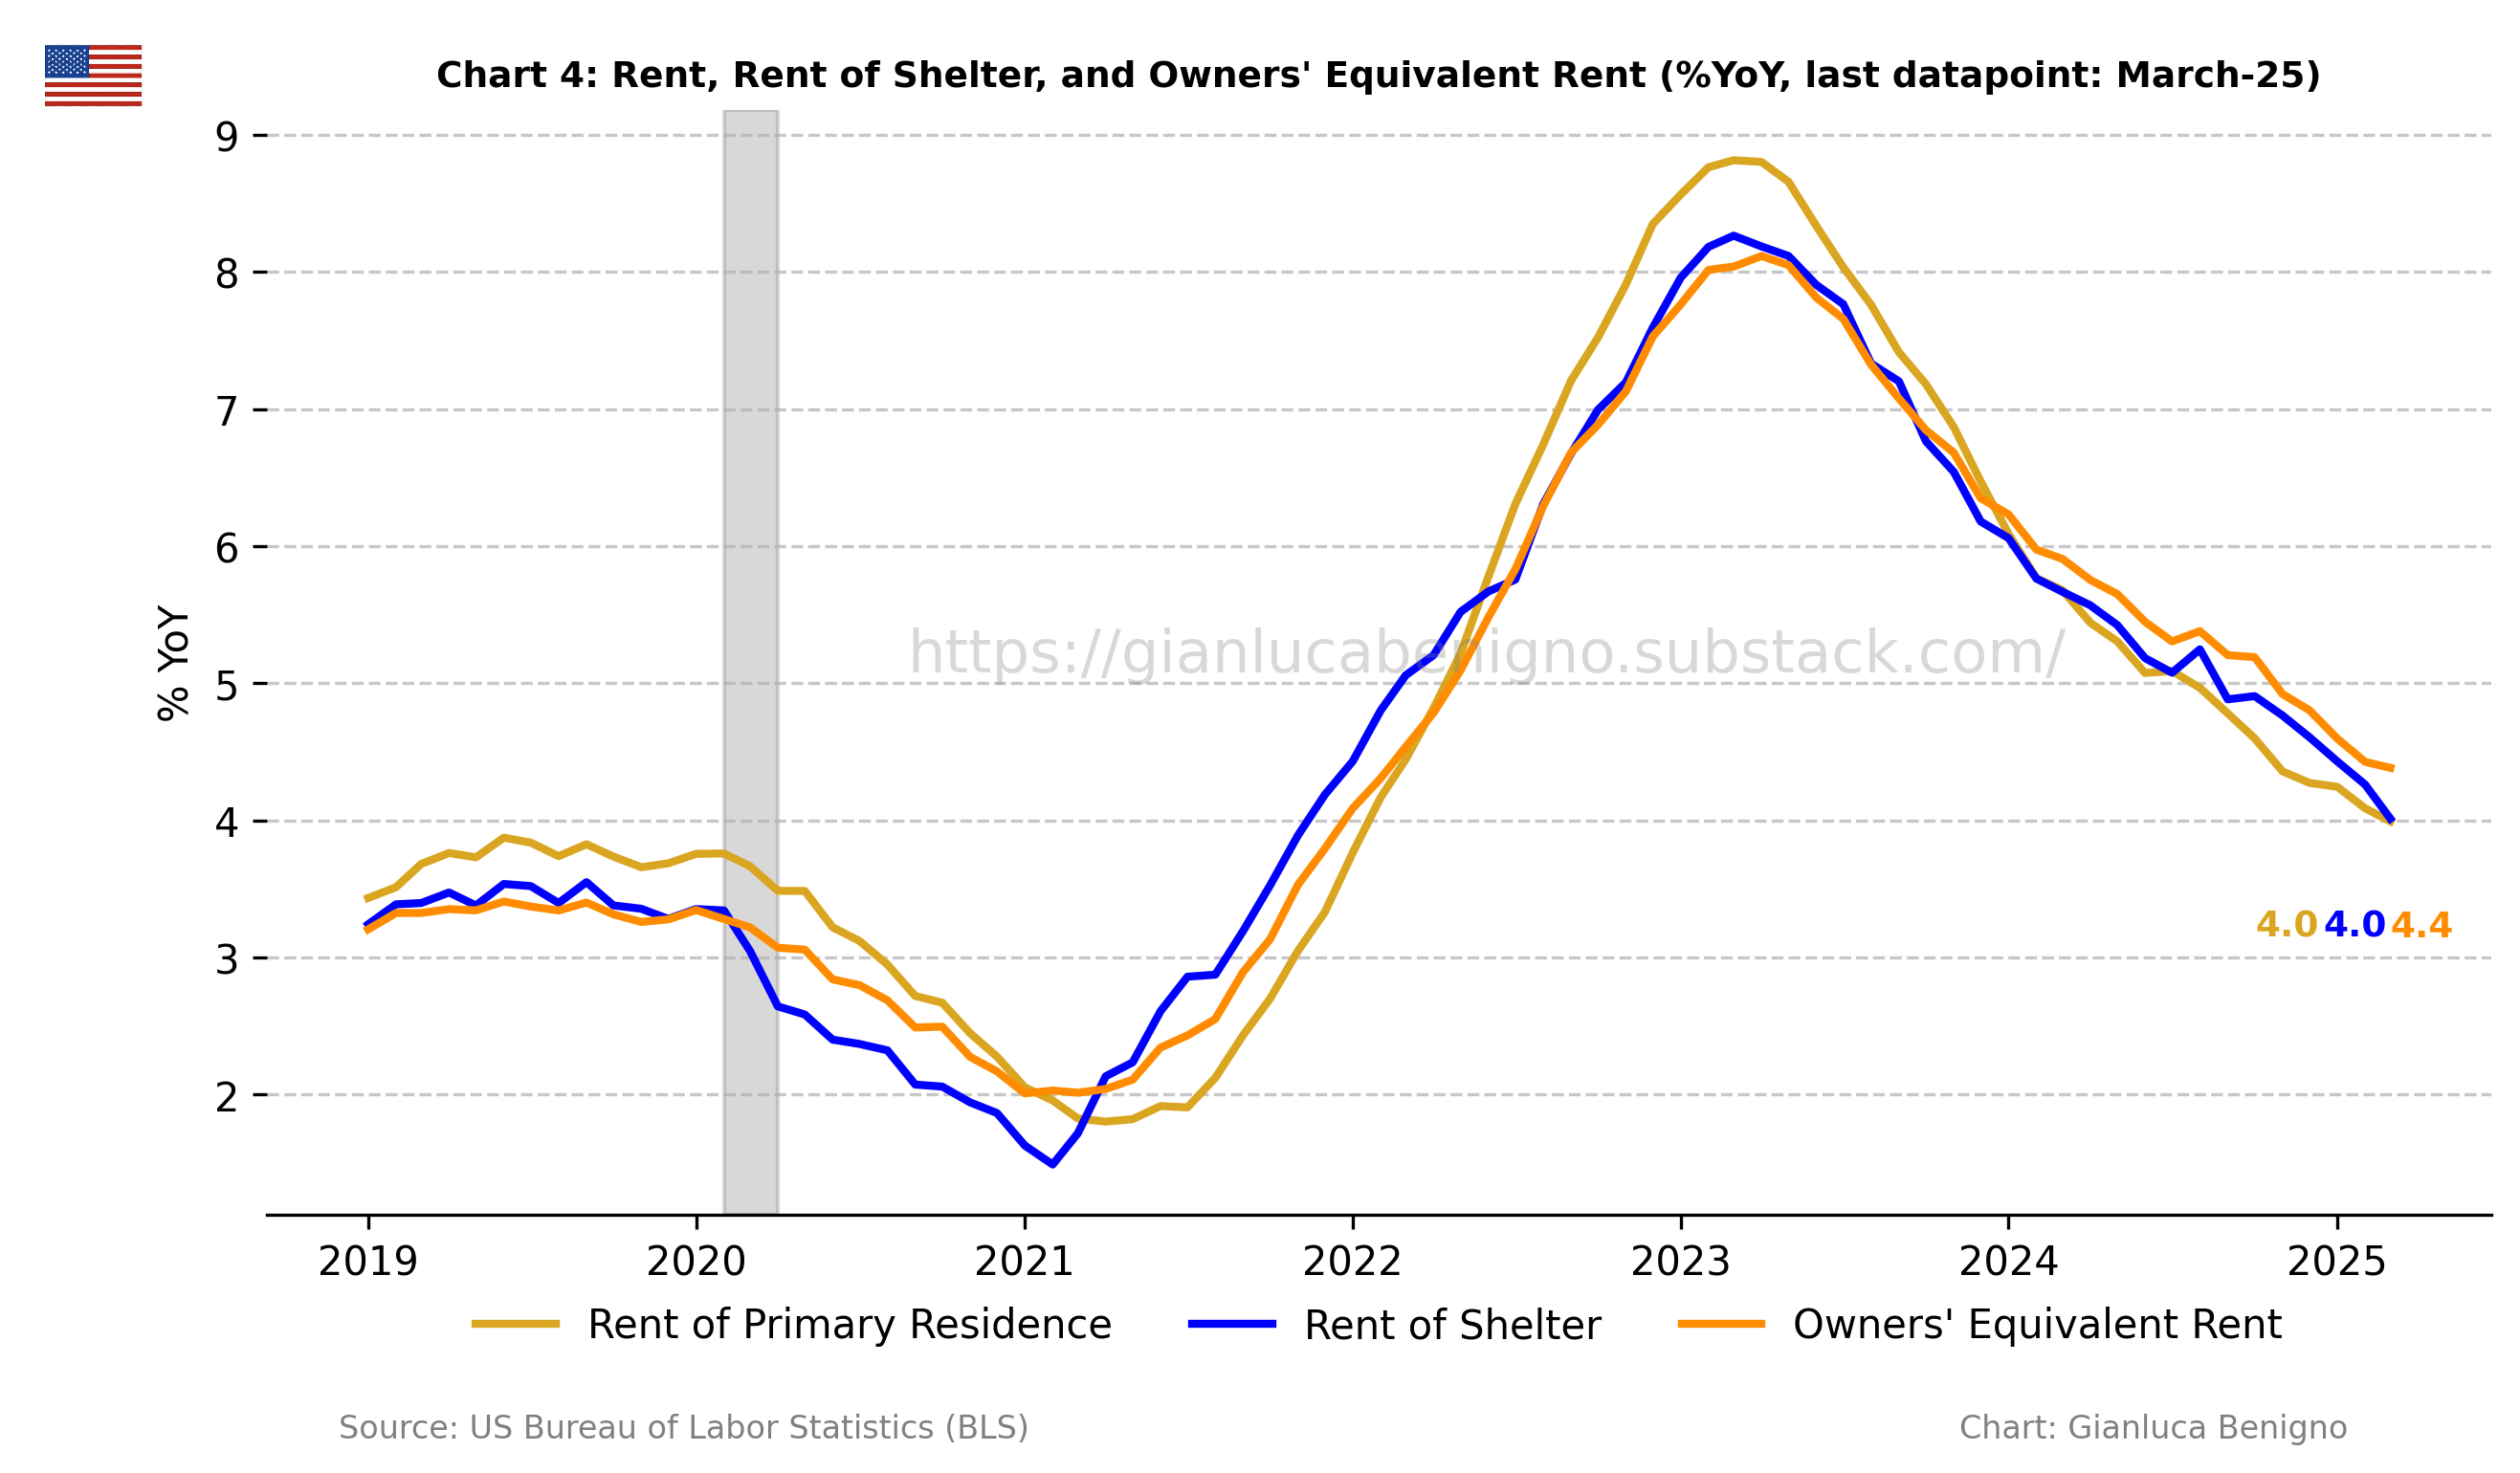
The primary factor behind recent inflationary pressures is still the rent of shelter component of the Consumer Price Index (CPI). Rent of shelter increased by 4.0% YoY in March, improving from the 4.3% YoY increase recorded in February. The month-on-month increase was 0.3% vs 0.4% MoM in February.
The slow adjustment of core service inflation and its housing component are the key factors behind the lack of adjustment towards the 2% target. Nonetheless, this release offers a promising signal of continued improvement. This marks the first time since 2022 that year-over-year services inflation has fallen below 4.0%. The monthly reading also improved, rising just 0.2% in March—down from 0.4% (n.s.a.) in February.
The next FOMC meeting is scheduled for May 6–7. Market expectations around a potential rate cut have fluctuated significantly—driven more by tariff-related headlines than by changes in the underlying economic data. This headline-sensitive dynamic is likely to persist in the lead-up to the meeting. That said, the latest inflation report offers some reassurance, suggesting that inflation remains on a path toward the Fed’s target—at least within the pre-tariff-shock environment.
Related Posts
U.S. February- 25 CPI Inflation Report (previous release)
U.S. January- 25 CPI Inflation Report (previous release)
U.S. December- 24 CPI Inflation Report (previous release)
U.S. November- 24 CPI Inflation Report (previous release)
U.S. October- 24 CPI Inflation Report (previous release)
U.S. September- 24 CPI Inflation Report (previous release)
50 or 25 bps? The cut that could split the Fed (context post)
Post FOMC update: the Fed and the Market Shifts (context post)
Scenario Analysis as Communication Device for Central Banking (related post)
Review of the Inflation Release
The Consumer Price Index (CPI) rose by 2.4% (n.s.a.) year-on-year (YoY) in March (Chart 1), below the market consensus at 2.5% YoY and February’s figure of 2.8% YoY increase. On a month-on-month basis (MoM), CPI increased by 0.2% MoM (n.s.a.), improving relative to the 0.4% MoM increase in February.
Core CPI (excluding food and energy) increased by 2.8% year-on-year in March (Chart 1), below market consensus at 3.0% YoY and February’s increase of 3.1% YoY. On a month-on-month basis, core CPI increased by 0.2% MoM (n.s.a.), in contrast to February’s 0.4% MoM increase. On a seasonally adjusted basis, the increase was at 0.1% MoM, moderating from the 0.2% MoM increase recorded in February.

Core services (services excluding energy) remain the primary driver of inflationary pressures. In March, core services increased by 3.7% YoY, compared to February’s 4.1% YoY increase, while core goods (goods excluding food and energy) remained in deflationary territory, experiencing a decline by 0.1% YoY, the same decline recorded in February. A welcome development is the decline in core services inflation, which has fallen below 4% YoY for the first time since 2022.
The following chart (Chart 2) illustrates this contrast between core goods and core services common to many advanced countries (except for Japan):

The CPI in March was primarily driven by the housing component (Tables 1 and 2). The rent of shelter components rose by 4.0% YoY in March, below the 4.3% YoY increase recorded in February. Noticeably, the shelter component increased by 0.3% on a month-on-month basis (n.s.a.) vs a 0.4% MoM increase in February.
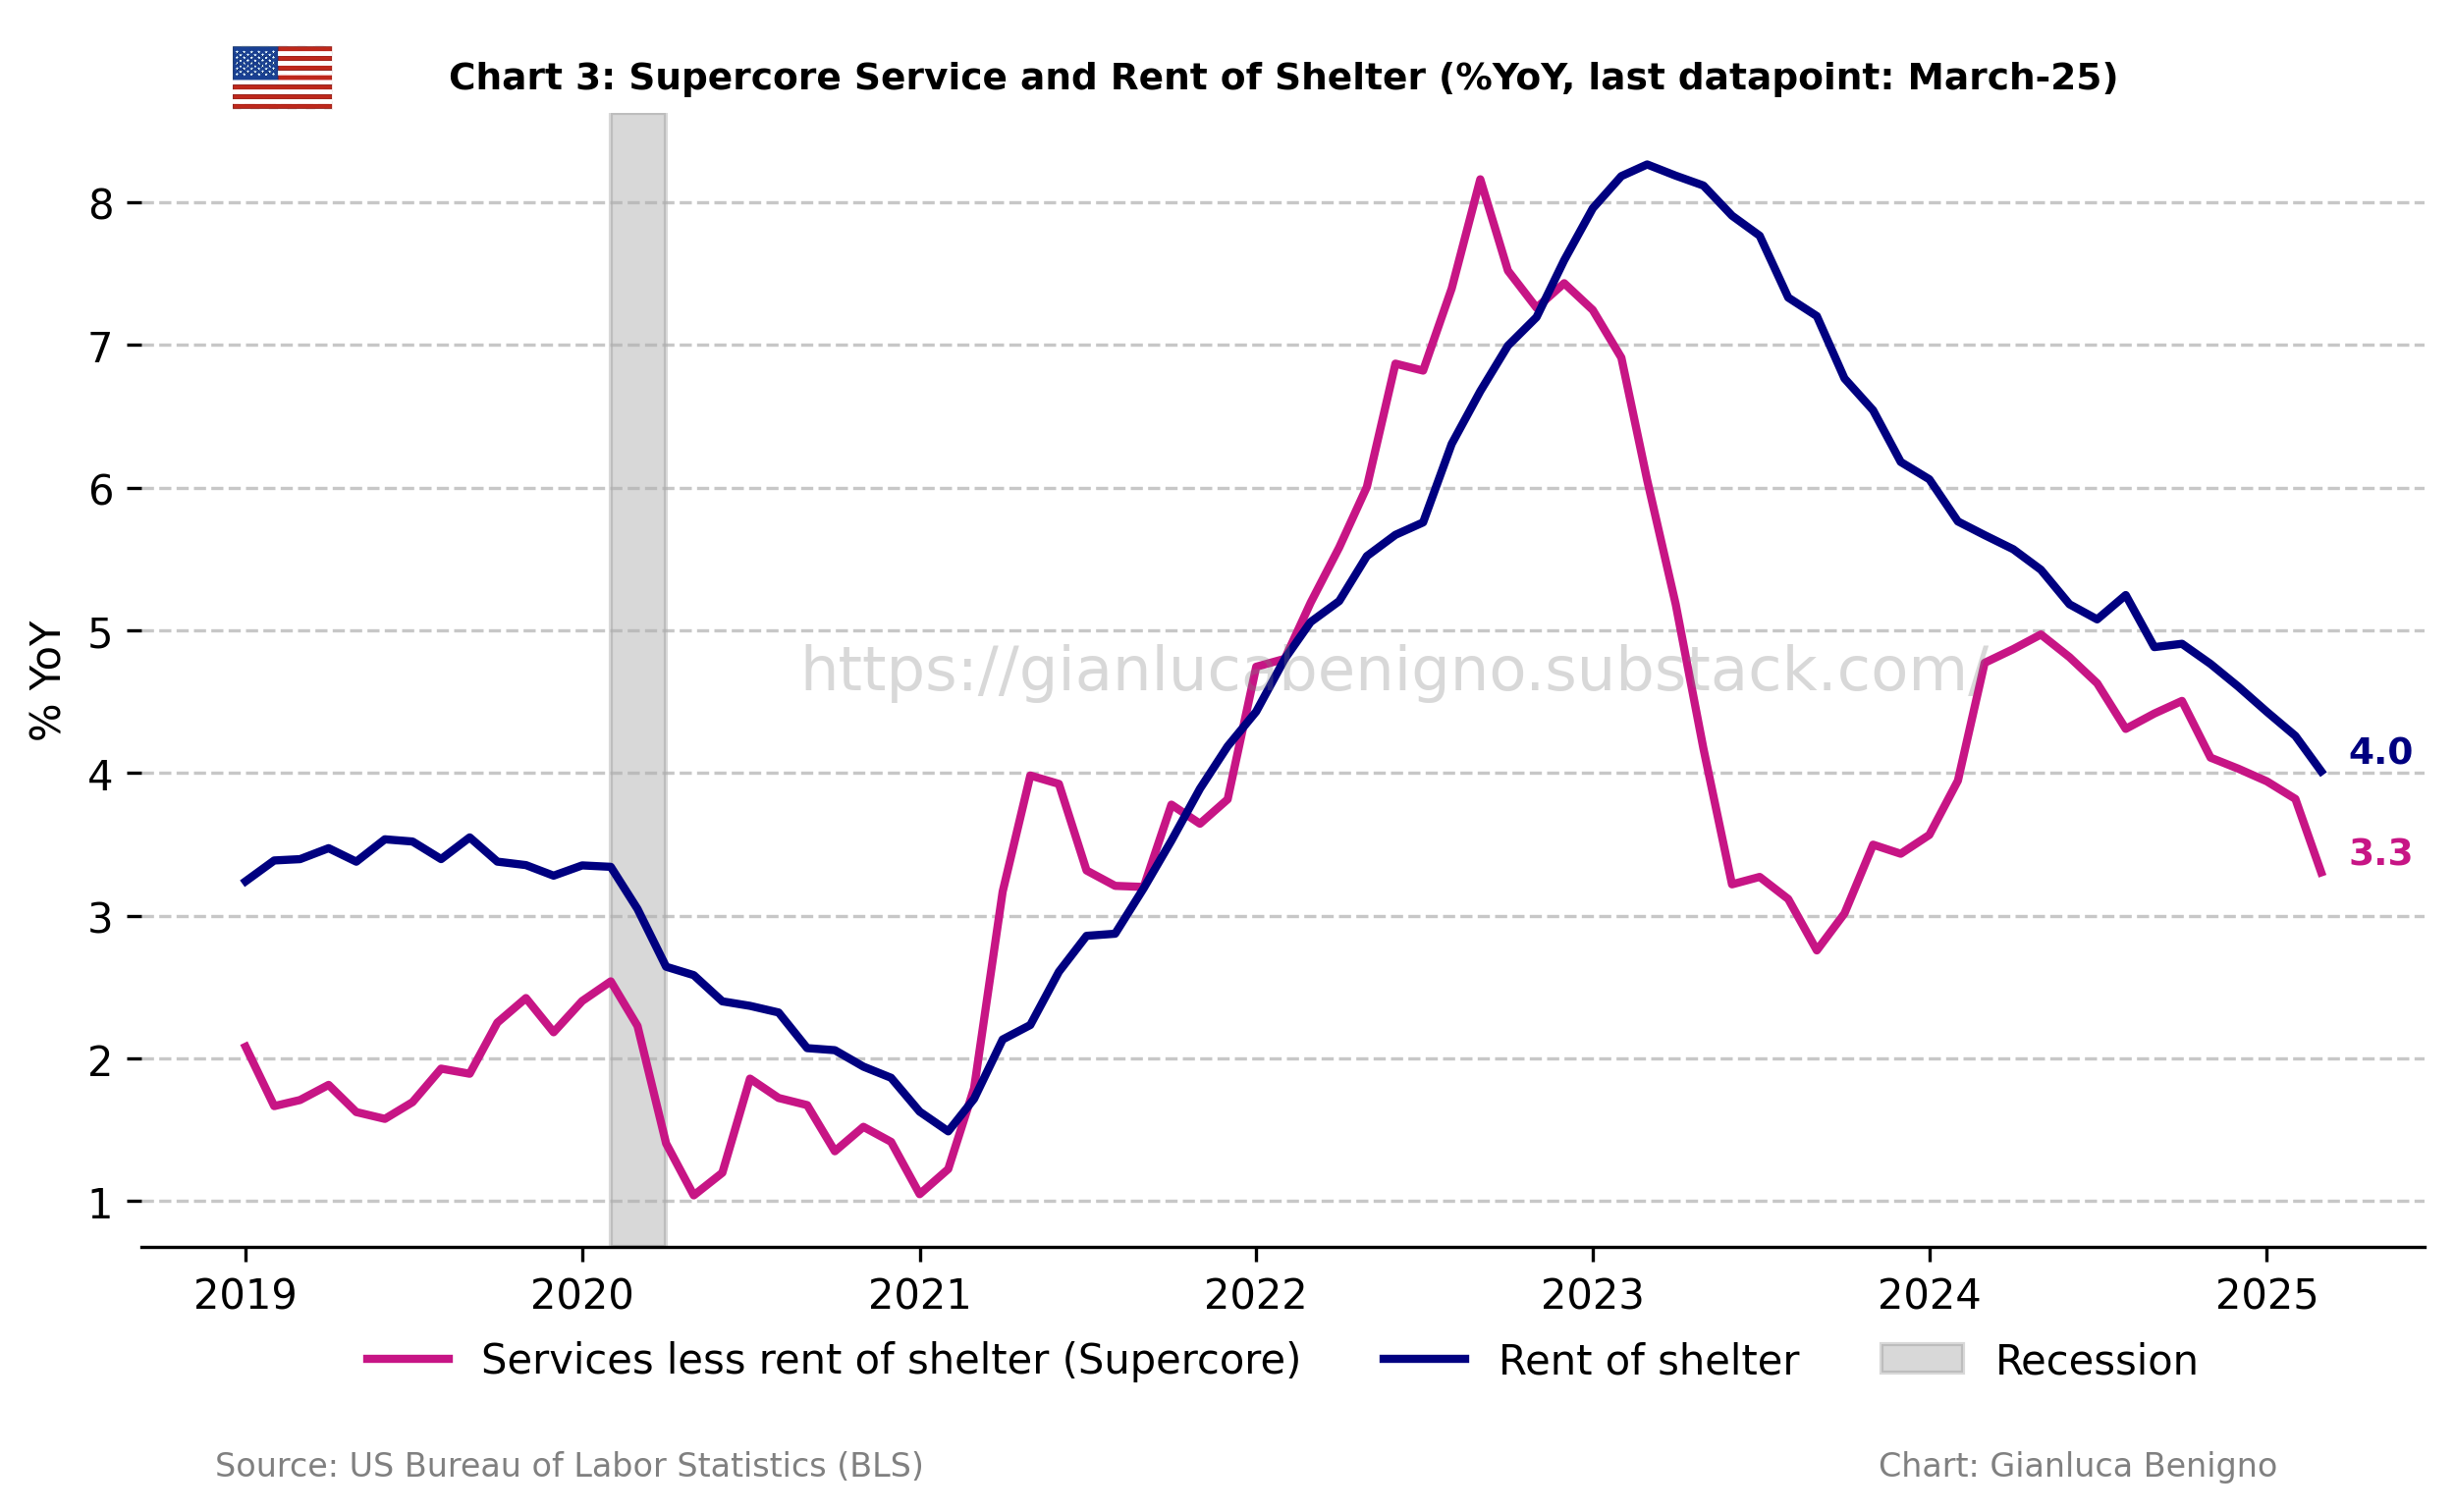
Within this context, supercore services (core services excluding shelter – Chart 3) increased by 3.3% year-on-year, significantly lower than the 3.8% increase in February. On a monthly basis, the supercore component increased by 0.2% MoM in March, much lower than February’s 0.5% MoM rise.
Summary
There are several encouraging signals in the latest inflation report. Core inflation has dropped below 3% since late 2023, core services inflation has also dropped under 4% for the first time since 2022. Moreover, a number of key monthly readings are showing continued improvement.
That said, there is still a notable asymmetry between goods and services developments. While goods prices remain in deflationary territory, services inflation, though easing, continues to run above 3%. A particularly positive development is the softening of the shelter component, with monthly figures pointing to a more moderate trajectory ahead.
These favorable trends, however, will be put to the test in the coming months, as the recent wave of tariffs could introduce renewed price pressures—particularly within core goods. The evolution of inflation and its key components in 2025 will offer important insight into how these opposing forces play out.
Meanwhile, tariff-related headlines have driven sharp swings in financial markets, especially around expectations for the upcoming FOMC meeting on May 6–7. Market pricing for a rate cut has fluctuated not in response to hard data but in reaction to policy news. This pattern is likely to continue, and despite its reassuring print, this inflation release is unlikely to be a decisive factor in the Fed's next decision.
Table 1: CPI by components (% YoY)
Source: Bureau of Labor Statistics (BLS)
Table 2: CPI by components (% MoM)

Source: Bureau of Labor Statistics (BLS)
Always an insightful read, thank you for keeping us informed.