


UK January-25 CPI Inflation Report
Hotter inflation and wage readings challenge the monetary policy outlook.

Key takeaways:
UK Consumer Price Index (CPI) increased by 3.0% year-on-year (YoY) in January, above December’s figure at 2.5% YoY and the market consensus of 2.8% YoY.
Core CPI in January increased by 3.7% YoY, in line with the consensus forecast, but above December’s figure of 3.2% YoY.
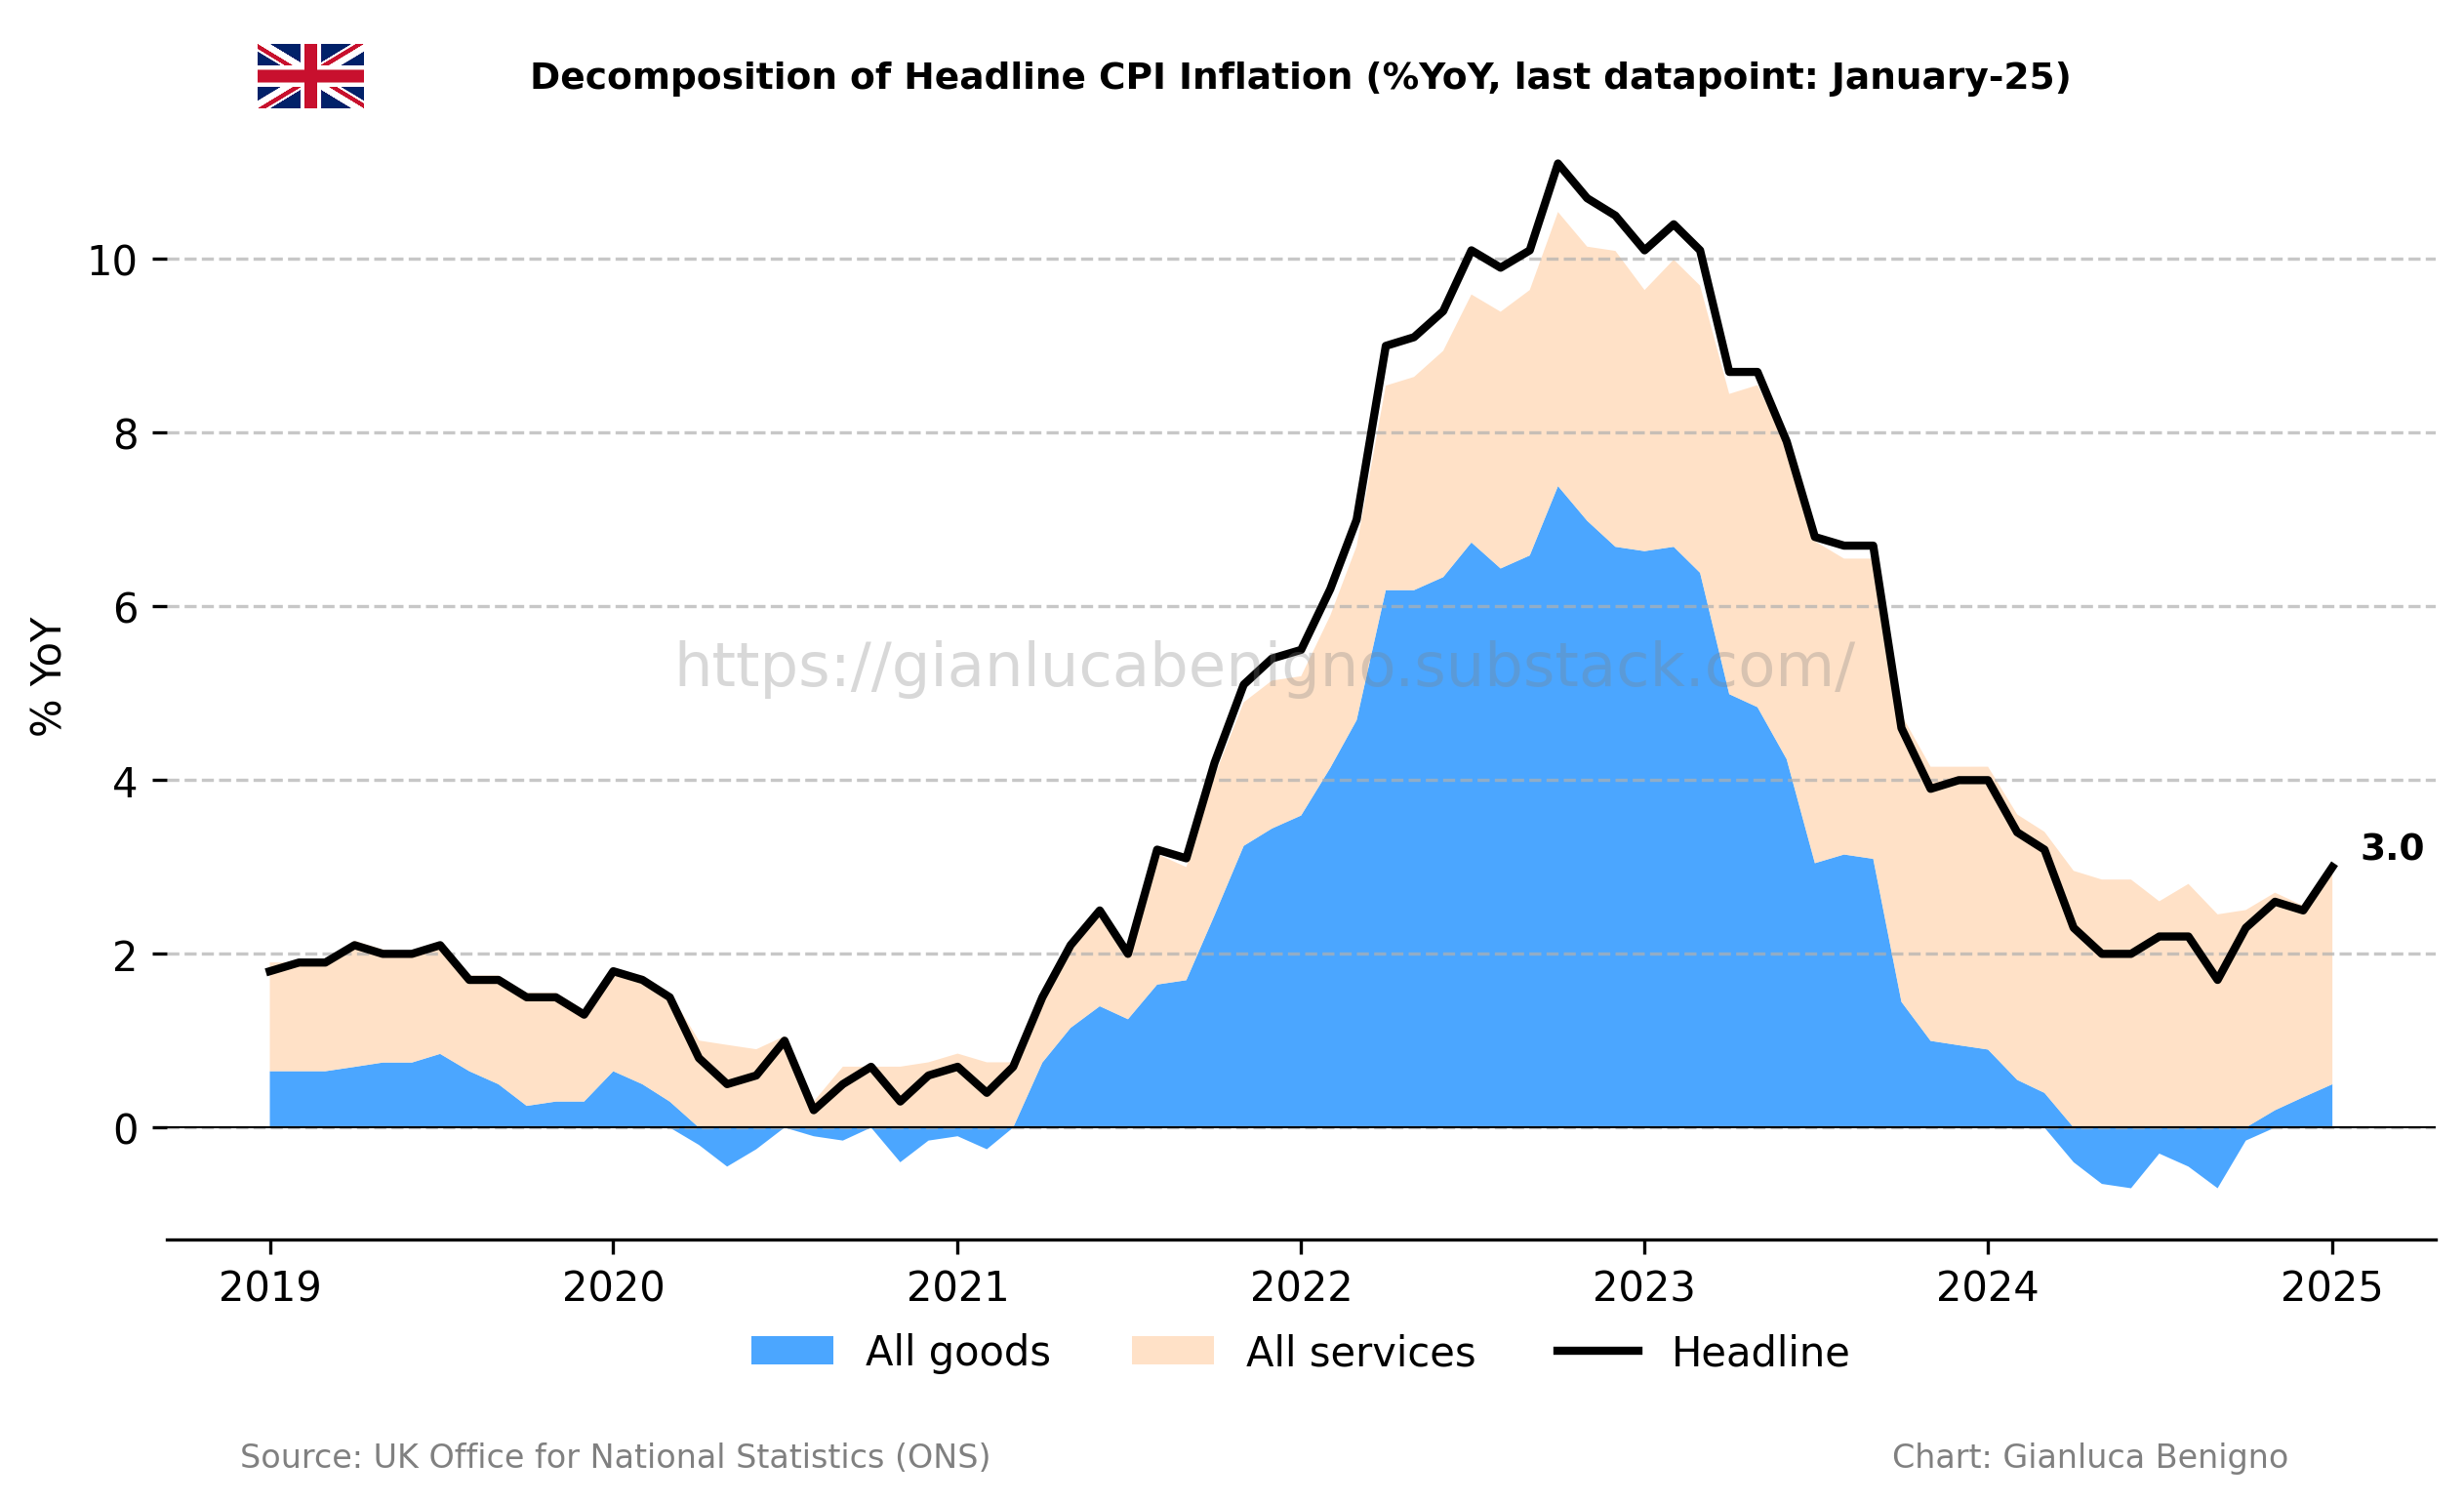
Consistent with the trend in advanced economies, inflationary pressures remain primarily concentrated in the services sector, which saw an increase of 5.0% YoY in January, significantly higher than the 4.4% YoY recorded in December. Meanwhile, inflation in the goods sector has been out of deflationary territory for the third consecutive month, rising 1.0% YoY, following December’s increase of 0.7% YoY.
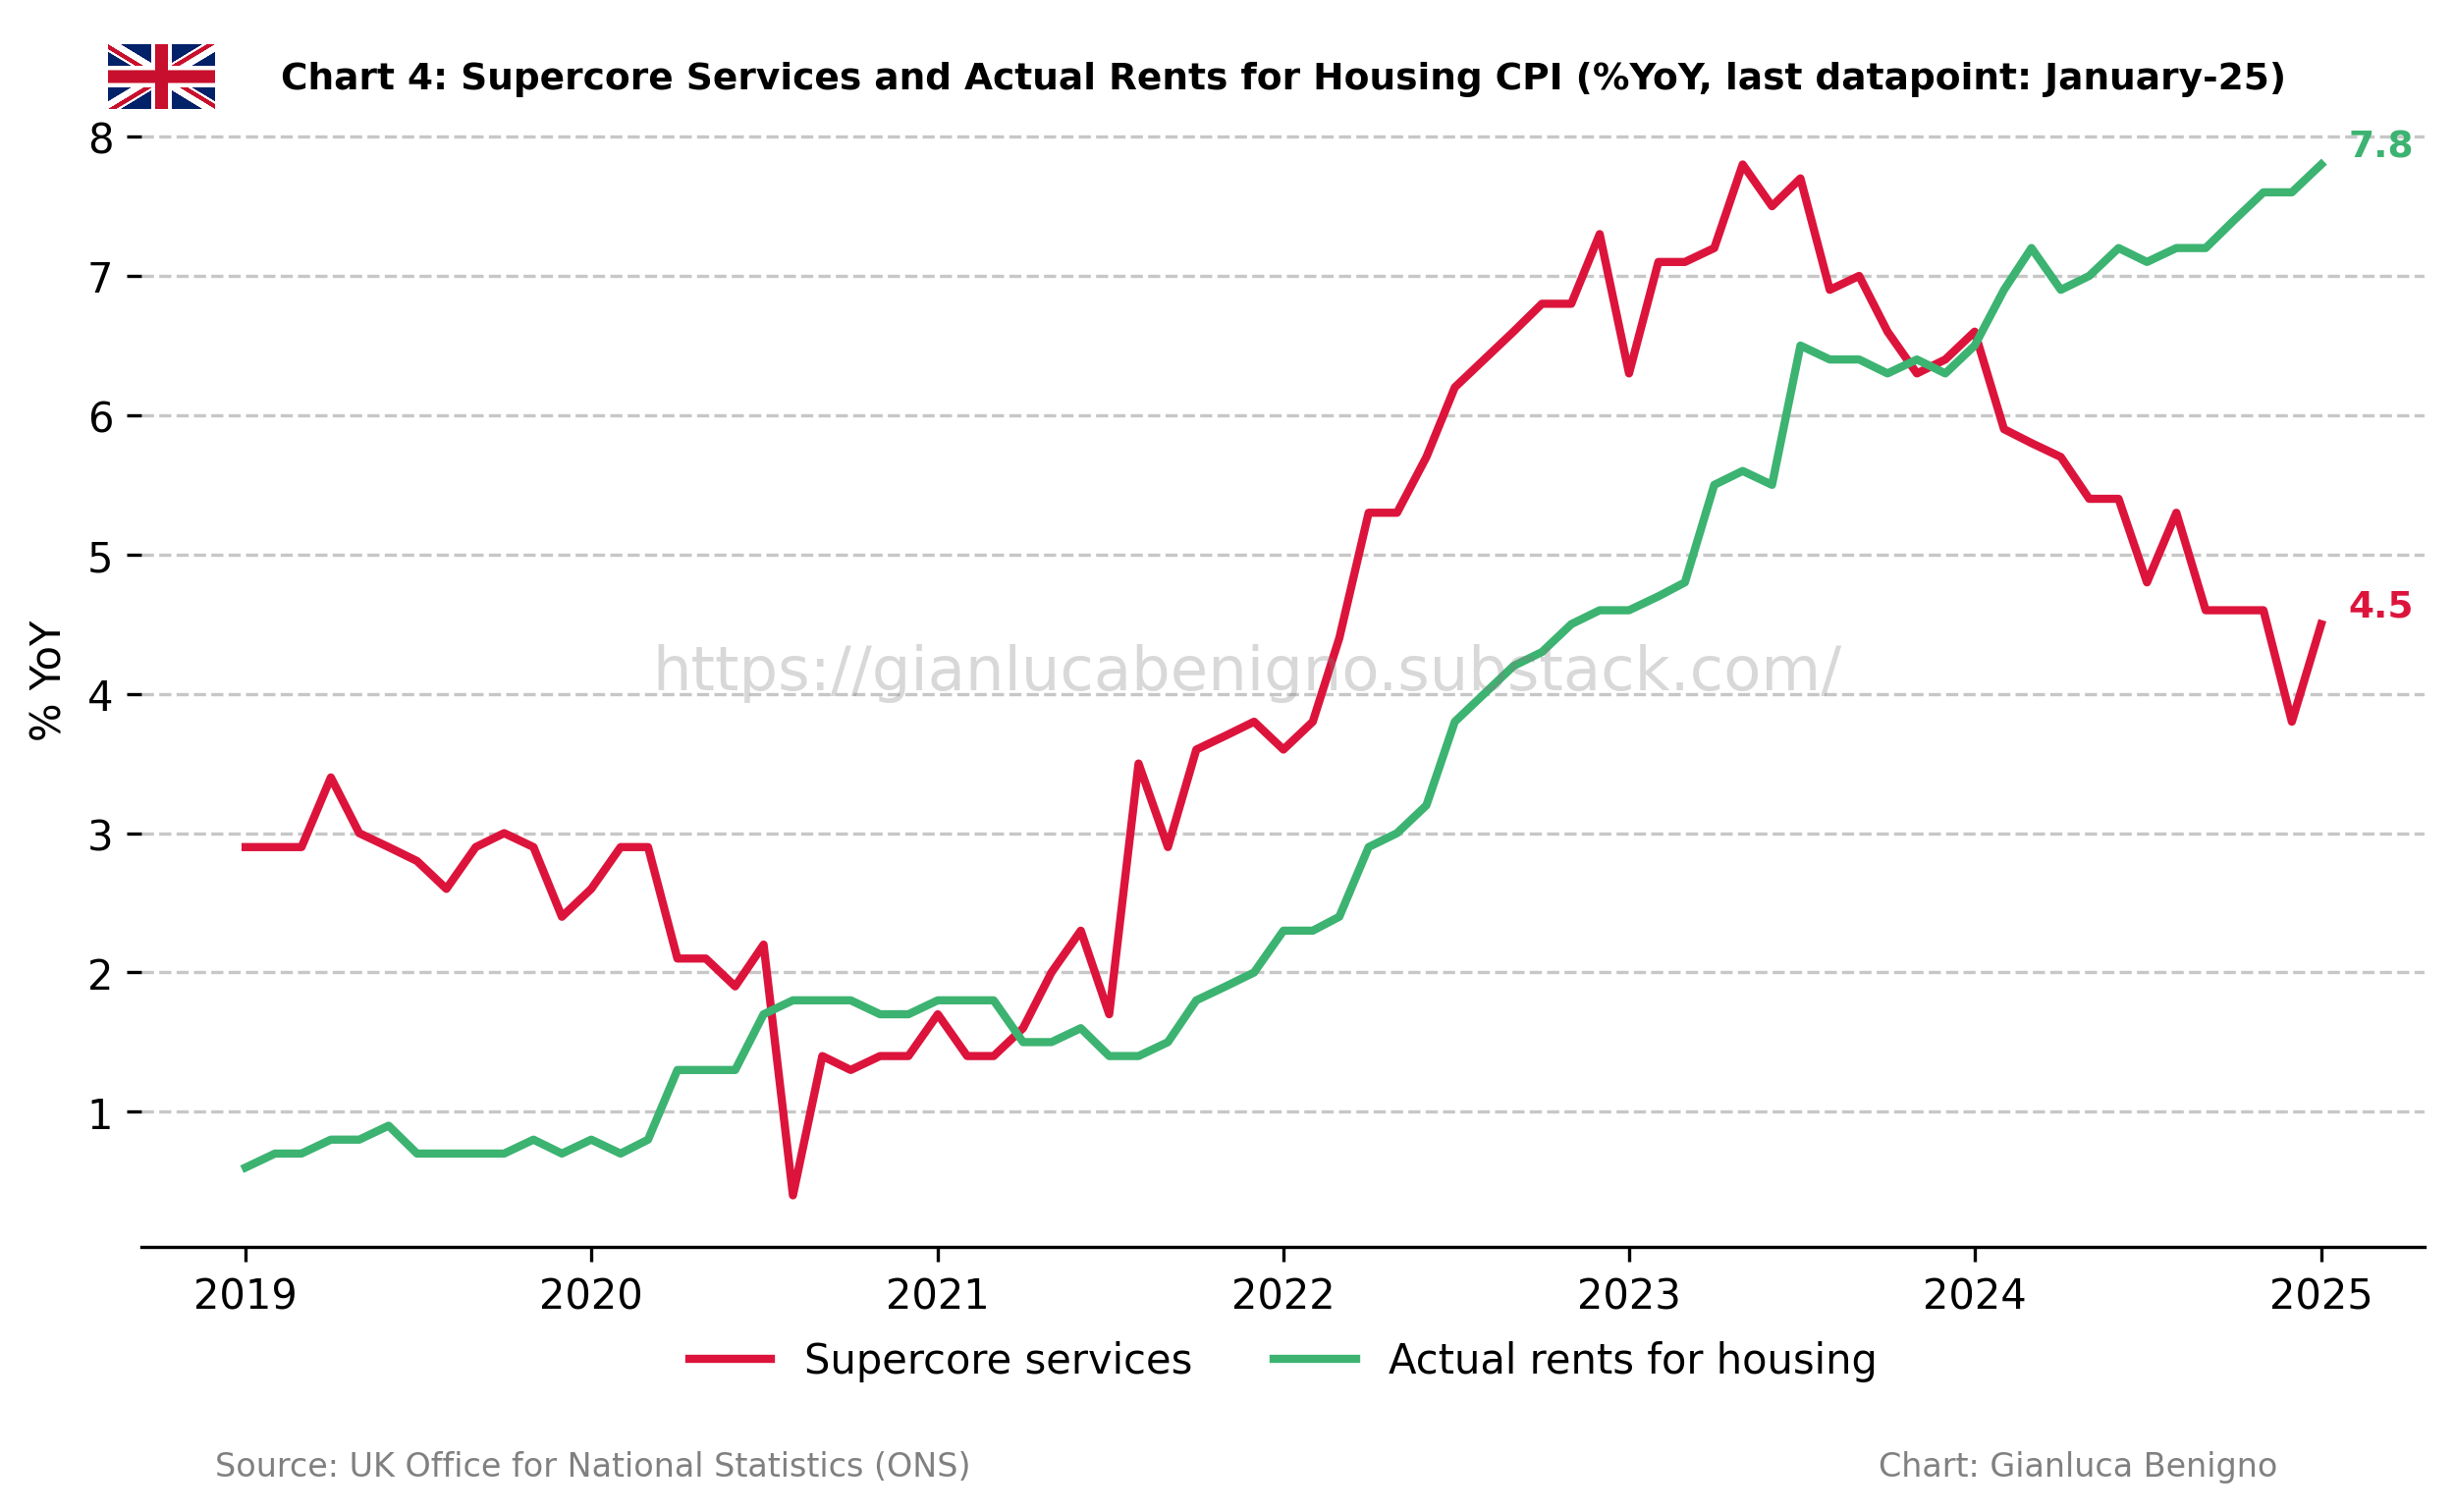
Within services, persistently higher housing costs remain the main driver of inflation. In January, actual rents for housing increased by 7.8% YoY (versus 7.6% YoY in December, 7.6% YoY in November, and 7.4% YoY in October 2024).
Our supercore service inflation, which removes actual rents for housing from services CPI, increased by 4.5% YoY in January, compared to the 3.8% YoY increase recorded in December.
This is the final inflation release before the Bank of England's monetary policy decision on March 20th, when the BoE is expected to keep rates at 4.5%. The latest data presents a challenging inflation outlook, as most measures edged higher in January.
The persistence of high wage growth, both in aggregate figures and in our supercore measures complicates further the inflation outlook. An additional idiosyncratic factor in this release is the rise in education inflation, driven by higher private school fees. On a more positive note, few month-on-month readings were negative. Housing costs on the other hand increased by 0.7% MoM significantly up from December 0.3% MoM.
Related posts (with links)
UK December-24 CPI Inflation Report (previous release);
UK November-24 CPI Inflation Report (previous release);
UK October-24 CPI Inflation Report (previous release);
UK September-24 CPI Inflation Report (previous release);
The Bank of England at a Crossroads: Rethinking the Narrative Before It’s Too Late? (related post);
Scenario Analysis as Communication Device for Central Banking (related post);
A Quasi-Global Inflation Overview (related post);
Has Wage Growth Fueled Inflation in the UK? (related post);
At the Core of UK Inflation (construction of supercore inflation and supercore wage index);
FT Alphaville on Catch-22 (short version of the Catch-22 effect);
Is the Bank of England in a Catch-22 Situation (long version of the Catch-22 effect);
Review of the Inflation Release

In January 2025, consumer prices increased by 3.0% year-on-year (YoY), above the market consensus at 2.8%, and December’s figure at 2.5% YoY. On a month-on-month (MoM) basis, consumer prices declined by 0.1%, lower than the 0.3% MoM increase recorded in December.
Core CPI, which excludes food and energy, rose by 3.7% YoY, in line with the consensus forecast, but above December’s figure of 3.2% YoY increase (see Charts 1 and 2). On a month-on-month basis, core CPI declined by 0.4%, lower than the 0.3% MoM increase recorded in December. The current release indicates an overall worsening of the inflation outlook on a year-on-year basis while monthly comparison shows deflation in both the headline and core measures.

The services sector remains the primary driver of inflation, with an increase of 5.0% YoY in January, higher than the 4.4% YoY figure observed in December. On a monthly basis, service inflation decreased by 0.2% MoM, lower than the 0.3% MoM increase observed in December. Goods sector inflation showed a 1.0% YoY increase in January, higher than the 0.7% increase observed in December. On a month-on-month basis, goods inflation decreased by 0.1% MoM, versus a 0.3% increase in December. Chart 3 highlights the persistence of service inflation and the recent uptick in goods price inflation, which is now adding to overall inflation rather than offsetting it, as it did for most of 2024.

A distinctive feature of inflation developments in the UK has been the ongoing rise in housing inflation (what we refer to as the “Catch-22” effect), which has been the primary driver of inflationary pressures (Table 1). Actual rents for housing rose by 7.8% YoY – compared to December’s and November’s figures (both 7.6%) –, consolidating the upward trend of housing prices seen since September 2021, a tail-end effect of the "higher for longer" rates in the UK. On a month-to-month basis, actual rents rose by 0.7% compared to 0.3% MoM in December and 0.6% MoM in November.
In this context, we’ve updated our supercore wage index after yesterday’s above-expected nominal wage data release (Chart 5). As can be seen, there was an increase of 6.2% YoY in December, higher than November’s 5.4% YoY upturn. Overall wages have also increased by 6.0% YoY higher than the 5.6% YoY (n.s.a.) increase observed in November.

Policy Implications
The Bank of England’s decision is due on March 20th. There is currently a consensus in markets that the BoE should hold rates in its next meeting, before re-starting its cutting cycle. The latest inflation release could slow the pace of the easing cycle, depending on how the Monetary Policy Committee balances rising inflation against a weakening economic outlook.
One of the key aspects of the policy decision, as highlighted in the latest Monetary Policy Report, is the persistence of service inflation and its relationship with inflationary wage pressures. Within this narrative, the current release shows a worsening of service inflation and further pressures coming from wage inflation. A key driver of overall inflation is still the rental housing component which increased further to 7.8% YoY and with a significant 0.7% MoM increase.
Market expectations have scaled back rate cuts of the Bank of England for 2025. They are now pricing around two more rate cuts in 2025.
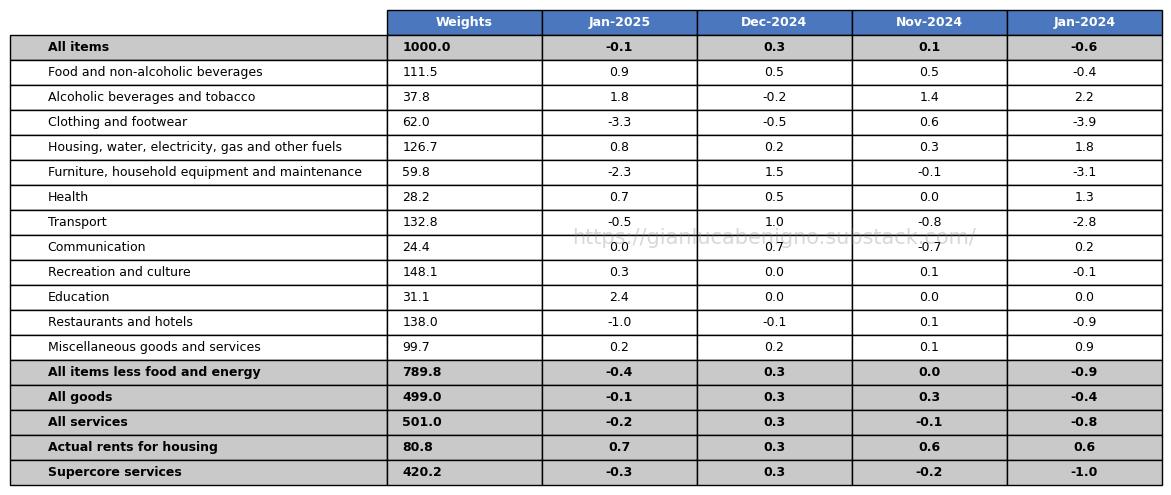
Table 1: CPI by components (% YoY)

Source: UK Office of National Statistics (ONS)
Table 2: CPI by components (% MoM)
Source: UK Office of National Statistics (ONS).