


UK February-25 CPI Inflation Report
Slightly better headline and core inflation than market expectations but still relatively high service inflation.


Key takeaways:
UK Consumer Price Index (CPI) increased by 2.8% year-on-year (YoY) in February, below January’s figure at 3.0% YoY and the market consensus of 3.0% YoY.
Core CPI in February increased by 3.5% YoY, below the consensus forecast of a 3.6% YoY rise and January’s figure of 3.7% YoY.
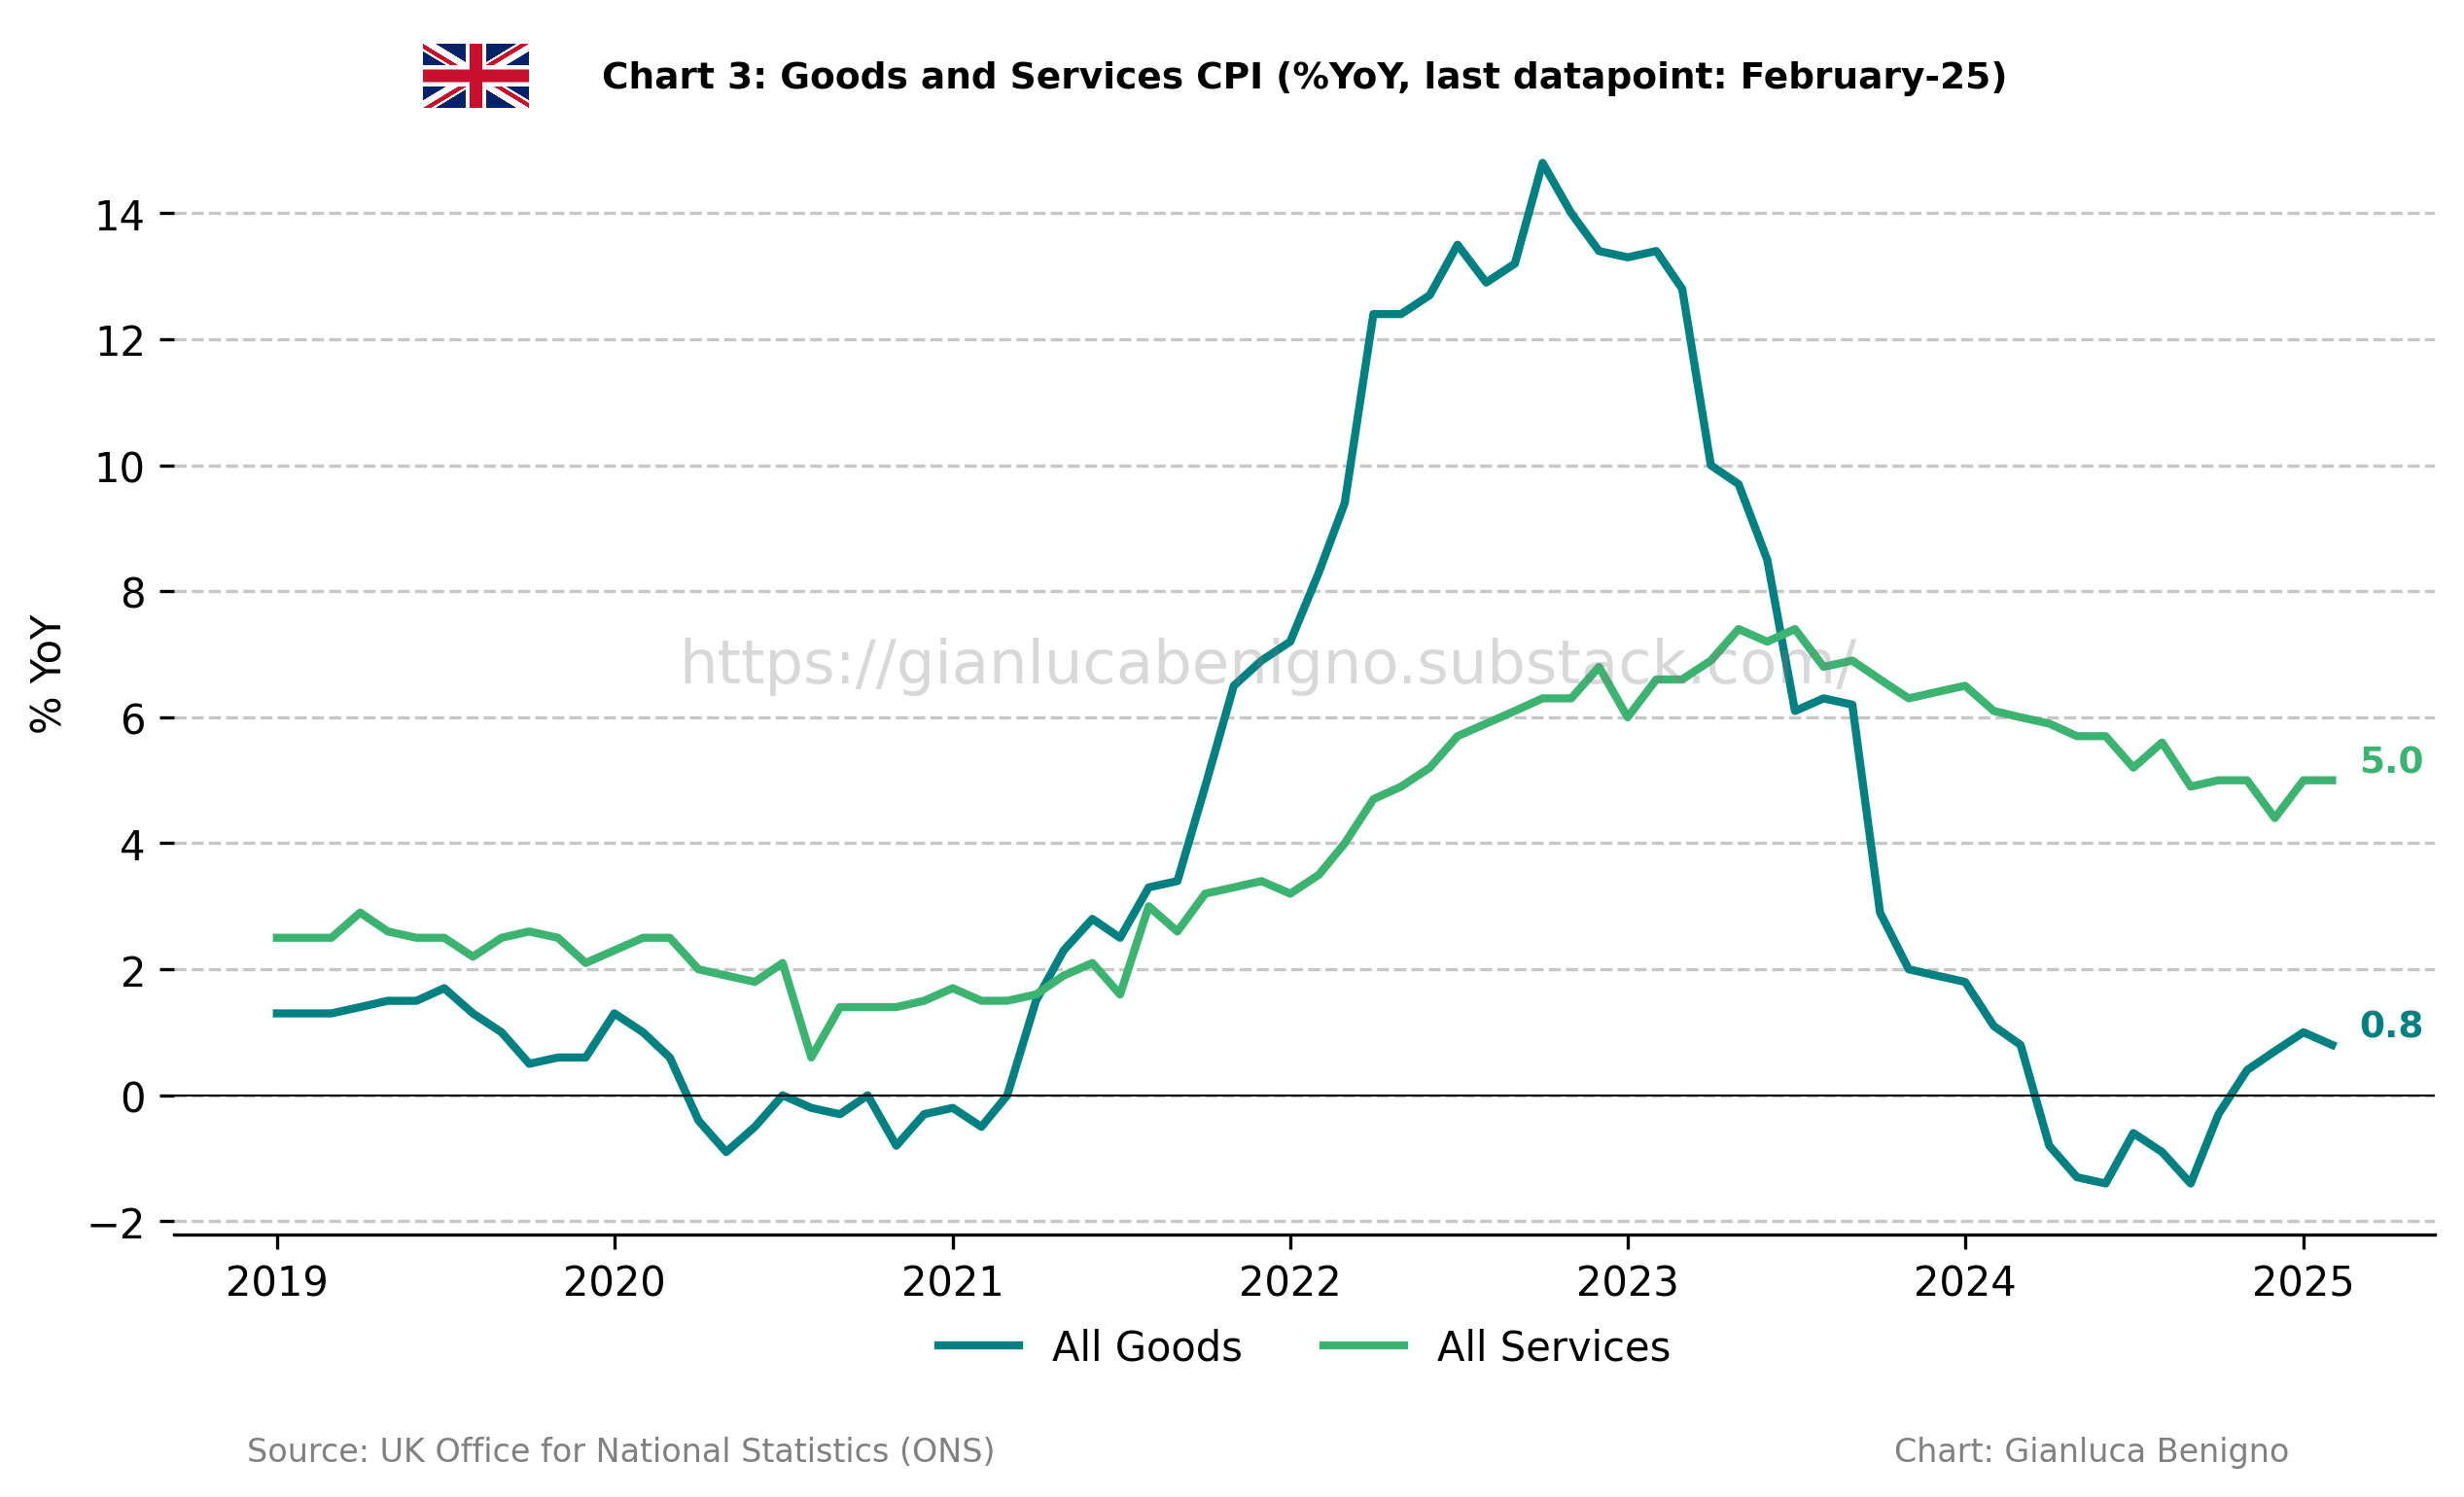
Consistent with the trend in advanced economies, inflationary pressures remain primarily concentrated in the services sector, which saw an increase of 5.0% YoY in February, the same increase as in January 2025. Meanwhile, inflation in the goods sector has been out of deflationary territory for the fourth consecutive month, rising 0.8% YoY, following January’s increase of 1.0% YoY.
Within services, persistently higher housing costs remain the main driver of inflation. In February, actual rents for housing increased by 7.4% YoY (versus 7.8% YoY in January, 7.6% YoY in December, and 7.6% YoY in November 2024).
Our supercore service inflation (which removes actual rents for housing from services CPI) increased by 4.5% YoY in February, the same increase as in January.
The persistence of high wage growth, both in aggregate figures and in our supercore measures, complicates the inflation outlook. Housing costs, on the other hand, increased by 0.3% MoM, a welcome reduction compared to January’s 0.7% MoM.
On March 20th, the Bank of England (BoE) maintained its policy rate at 4.5%, as decided by an 8-1 majority vote from the Monetary Policy Committee (MPC). This decision reflects the BoE's cautious approach amid ongoing global economic uncertainties and persistent inflation pressures. The MPC emphasized a "gradual and careful approach" to future rate adjustments, indicating that while further cuts may be considered, they will depend on evolving economic conditions. The current report reinforces this view, with developments in economic activity and upcoming fiscal announcements potentially influencing the monetary policy outlook.
Related posts (with links)
UK January-25 CPI Inflation Report (previous release)’
UK December-24 CPI Inflation Report (previous release);
UK November-24 CPI Inflation Report (previous release);
UK October-24 CPI Inflation Report (previous release);
The Bank of England at a Crossroads: Rethinking the Narrative Before It’s Too Late? (related post);
Scenario Analysis as Communication Device for Central Banking (related post);
A Quasi-Global Inflation Overview (related post);
Has Wage Growth Fueled Inflation in the UK? (related post);
At the Core of UK Inflation (construction of supercore inflation and supercore wage index);
FT Alphaville on Catch-22 (short version of the Catch-22 effect);
Is the Bank of England in a Catch-22 Situation? (long version of the Catch-22 effect).
Review of the Inflation Release

In February 2025, consumer prices increased by 2.8% year-on-year (YoY), lower than the market consensus of 3.0% and January’s figure of 3.0% YoY. On a month-on-month (MoM) basis, consumer prices increased by 0.4%, higher than the 0.1% MoM decrease recorded in January.
Core CPI, which excludes food and energy, rose by 3.5% YoY, below the consensus forecast of 3.6% YoY and January’s 3.7% YoY increase (see Charts 1 and 2). On a month-on-month basis, core CPI increased by 0.4%, higher than the 0.4% MoM decline recorded in January.

The services sector remains the primary driver of inflation, with an increase of 5.0% YoY in February, the same increase as the one observed in January. On a monthly basis, service inflation increased by 0.5% MoM, higher than the 0.2% MoM decrease observed in January. The goods sector inflation showed a 0.8% YoY increase in February, lower than the 1.0% increase observed in January. On a month-on-month basis, goods inflation increased by 0.4% MoM versus a 0.1% decrease in January. Chart 3 highlights the persistence of service inflation and the recent uptick in goods price inflation, which is now adding to overall inflation rather than offsetting it, as it did for most of 2024.
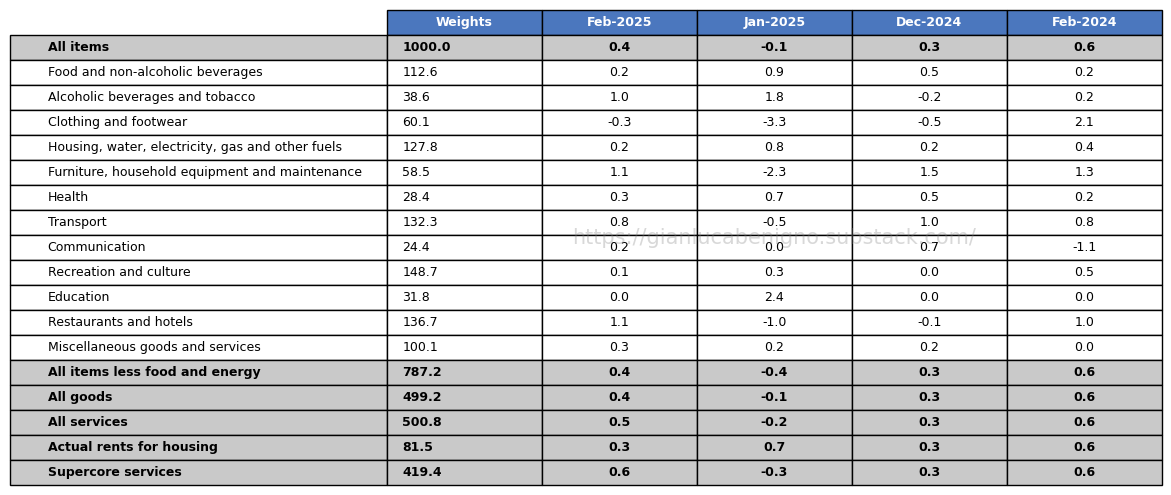
A distinctive feature of inflation developments in the UK has been the ongoing rise in housing inflation (what we refer to as the “Catch-22” effect), which has been the primary driver of inflationary pressures (Table 1). Actual rents for housing rose by 7.4% YoY – compared to January’s 7.8% YoY increase and December’s 7.6% YoY increase – reversing partly the upward trend of housing prices seen since September 2021, a tail-end effect of the "higher for longer" rates in the UK. On a month-to-month basis, actual rents rose by 0.3%, compared to 0.7% MoM in January and 0.3% MoM in December.

In this context, we’ve updated our supercore wage index following the release of nominal wage data (Chart 5). As can be seen, there was an increase of 6.4% YoY in January, the same as December’s 6.4% YoY increase. Overall wages have also increased by 5.8% YoY, slightly lower than the 6.1% YoY (n.s.a.) increase observed in December.

Policy Implications
On March 20th, the Bank of England (BoE) maintained its policy rate at 4.5%, with the Monetary Policy Committee (MPC) voting 8-1 in favor of this decision. This decisive majority underscores the MPC's commitment to a cautious approach amid global economic uncertainties, including intensified trade tensions and geopolitical risks. The lone dissenting member, Swati Dhingra, advocated for a 0.25 percentage point cut to stimulate demand. The vote split to stay on hold was a hawkish surprise and triggered an upward adjustment to UK rate expectations. Despite the better-than-expected inflation outlook, the slow progress on inflation supports the monetary policy outlook outlined by the MPC.
The MPC emphasized a "gradual and careful approach" to future policy adjustments, indicating that while further cuts may be considered, they will depend on evolving economic conditions. However, these projections remain contingent on the trajectory of inflation and overall economic performance. The BoE's cautious stance reflects the complex balancing act of supporting economic growth while ensuring that inflation returns sustainably to the 2% target.
Table 1: CPI by components (% YoY)

Source: UK Office of National Statistics (ONS)
Table 2: CPI by components (% MoM)
Source: UK Office of National Statistics (ONS).