


US April-25 CPI Inflation Report
Disinflation continues, as tariff-driven inflation fears have yet to materialize. The current release suggests no change in the "wait and see" monetary policy approach.


Key takeaways:
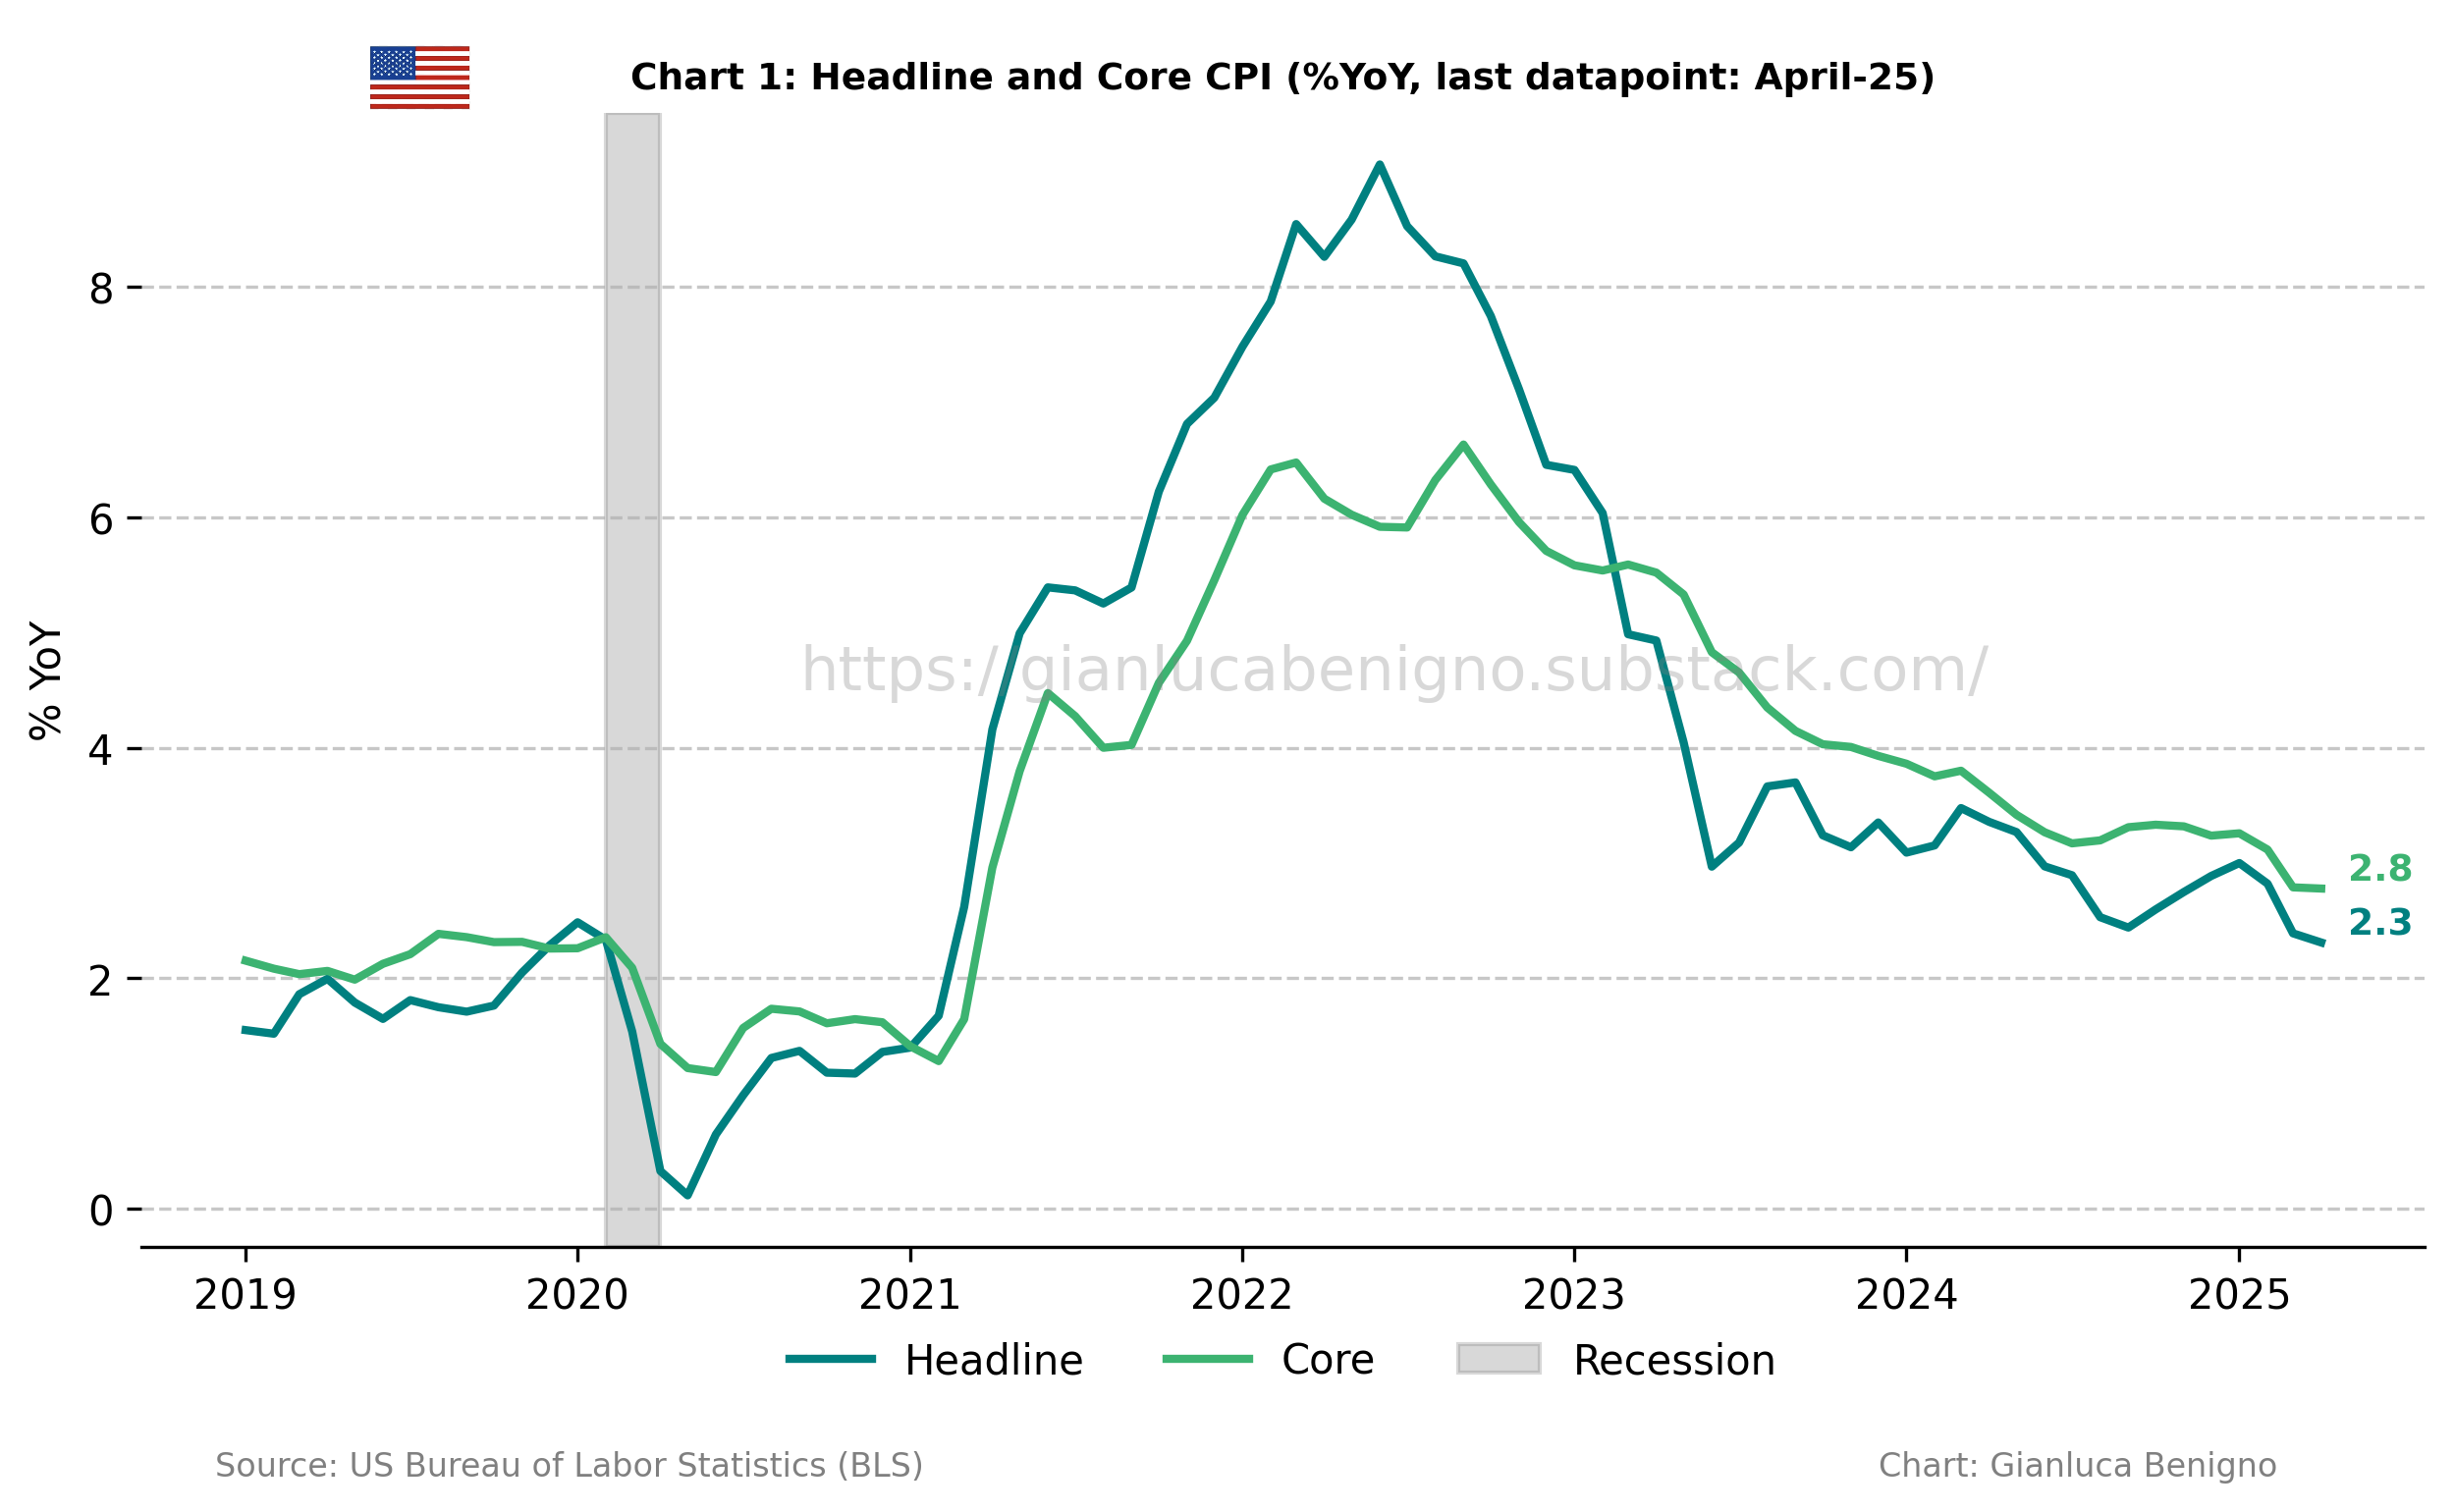
The overall Consumer Price Index (CPI, n.s.a.) increased by 2.3% year-on-year (YoY) in April, below the consensus expectation of 2.4% YoY and March’s reading of 2.4% YoY.
Core CPI in April was 2.8% YoY (n.s.a.), in line with March’s reading and the consensus forecast of 2.8% YoY.
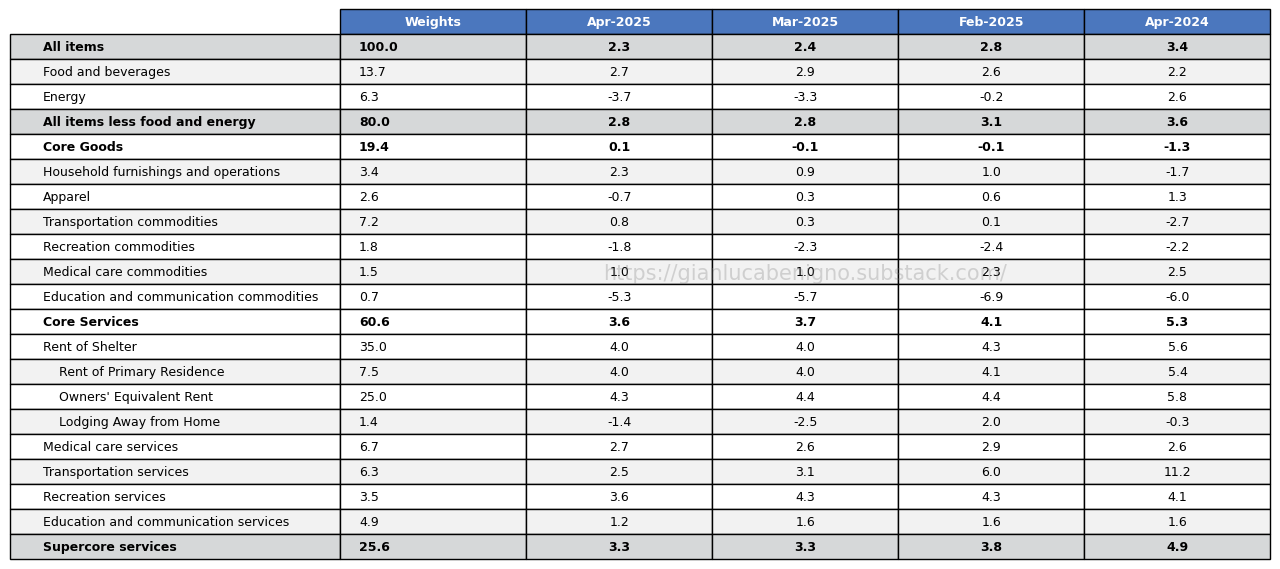
Inflationary pressures are primarily concentrated in the core service sector, with an increase of 3.6% YoY in April, below the 3.7% YoY observed in March. In contrast, the core goods sector (ex-energy and food) is experiencing very low inflation with an increase of 0.1% YoY, compared to March’s 0.1% YoY decrease.
The primary factor behind recent inflationary pressures is still the rent of shelter component of the Consumer Price Index (CPI). Rent of shelter increased by 4.0% YoY in April, the same rate as the one recorded in March. The month-on-month increase was 0.3% MoM (n.s.a.), the same rate as in March.
The slow adjustment of core service inflation and its housing component are the key factors behind the slow adjustment towards the 2% target. Nonetheless, this release offers a promising signal of continued improvement. This now marks the second time since 2022 that year-over-year services inflation has fallen below 4.0%. On a monthly basis, core service increased by 0.3% MoM in April, up from 0.2% MoM (n.s.a.) in March.
While the food and beverage categories show no change on a monthly basis (see Table 2), there were a few monthly declines in food subcategories.
This inflation report is consistent with the gradual disinflationary trend observed in recent months. Despite the tariffs imposed on Canada, China, and Mexico before April, the current data show no significant pickup in goods inflation or its subcomponents, suggesting that, so far, the impact of tariffs has not materialized at the CPI level.
Related posts (with links)
U.S. March-25 CPI Inflation Report (previous release)
U.S. February-25 CPI Inflation Report (previous release)
U.S. January-25 CPI Inflation Report (previous release)
U.S. December-24 CPI Inflation Report (previous release)
U.S. November-24 CPI Inflation Report (previous release)
50 or 25 bps? The cut that could split the Fed (context post);
Post FOMC update: the Fed and the Market Shifts (context post);
Scenario Analysis as a Communication Device for Central Banking (related post).
Review of the Inflation Release
The Consumer Price Index (CPI) rose by 2.3% (n.s.a.) year-on-year (YoY) in April (Chart 1), below the market consensus and March’s figure, both at 2.4% YoY. On a month-on-month basis (MoM), CPI increased by 0.3% MoM (n.s.a.), compared to 0.2% MoM in March.
Core CPI (excluding food and energy) increased by 2.8% year-on-year in April (Chart 1), in line with market consensus and March’s figure at 2.8% YoY. On a month-on-month basis, core CPI increased by 0.3% MoM (n.s.a.), in contrast to March’s 0.2% MoM increase. On a seasonally adjusted basis, the increase was at 0.2% MoM, up from the 0.1% MoM increase recorded in March.
Core services (services excluding energy) remain the primary driver of inflationary pressures. In April, core services increased by 3.6% YoY, compared to March’s 3.7% YoY increase, while core goods prices (goods excluding food and energy) rose by 0.1% YoY, above the 0.1% YoY decrease recorded in March. The current release confirms the deflationary trend in core services (now firmly below 4.0% YoY), a welcome development from the Fed’s perspective.
Despite the downward trend in services inflation, Chart 2 illustrates the contrast between core goods and core services, which is still common to many advanced countries (except for Japan).

As for past reports, CPI in April was primarily driven by the housing component (Tables 1 and 2). The rent of shelter components rose by 4.0% YoY in April, the same rate as the 4.0% YoY recorded in March. Noticeably, the shelter component increased by 0.3% on a month-on-month basis (n.s.a.), the same increase, on a monthly basis, as in March.

Within this context, supercore services (core services excluding shelter – Chart 3) increased by 3.3% year-on-year vs the 3.3% increase in March. On a monthly basis, the supercore component increased by 0.3% MoM in April, higher than March’s 0.2% MoM rise.

The rent subcomponent of the rent of shelter increased by 4.0% YoY, the same rate as in March 2025, while the owners’ equivalent rent rose by 4.3% YoY, lower than the 4.4% YoY recorded in March (see Chart 4).
Summary
There are several encouraging signals in the latest inflation report. Core inflation is again below 3% while services inflation has eased below the 4% range. The overall inflation outlook seems consistent with a slow disinflationary adjustment.
The current inflation release shows no evidence of tariff-related inflationary pressure. April's data, which could in principle reflect the impact of recently implemented tariffs on Canada, Mexico, and China, reveal no notable increase in core goods inflation or in key underlying categories. These early-stage tariffs (announced in January-February-March) have yet to translate into measurable price effects at the CPI level.
From a monetary policy perspective, the latest inflation reading is unlikely to alter the FOMC’s forward-looking assessment. Many FOMC participants have already signaled a wait-and-see approach, anticipating a potential deterioration in the inflation outlook following the April tariff announcements. Most expect these tariffs to push inflation above the levels projected in the December 2024 Summary of Economic Projections (SEP) during 2025.
Table 1: CPI by components (% YoY)
Source: Bureau of Labor Statistics (BLS).
Table 2: CPI by components (% MoM)

Source: Bureau of Labor Statistics (BLS)