


UK March-25 CPI Inflation Report
Weaker-than-anticipated CPI data, alongside a slowdown in service inflation, strengthens the case for the Bank of England to consider easing policy at its upcoming meeting.

Key takeaways:
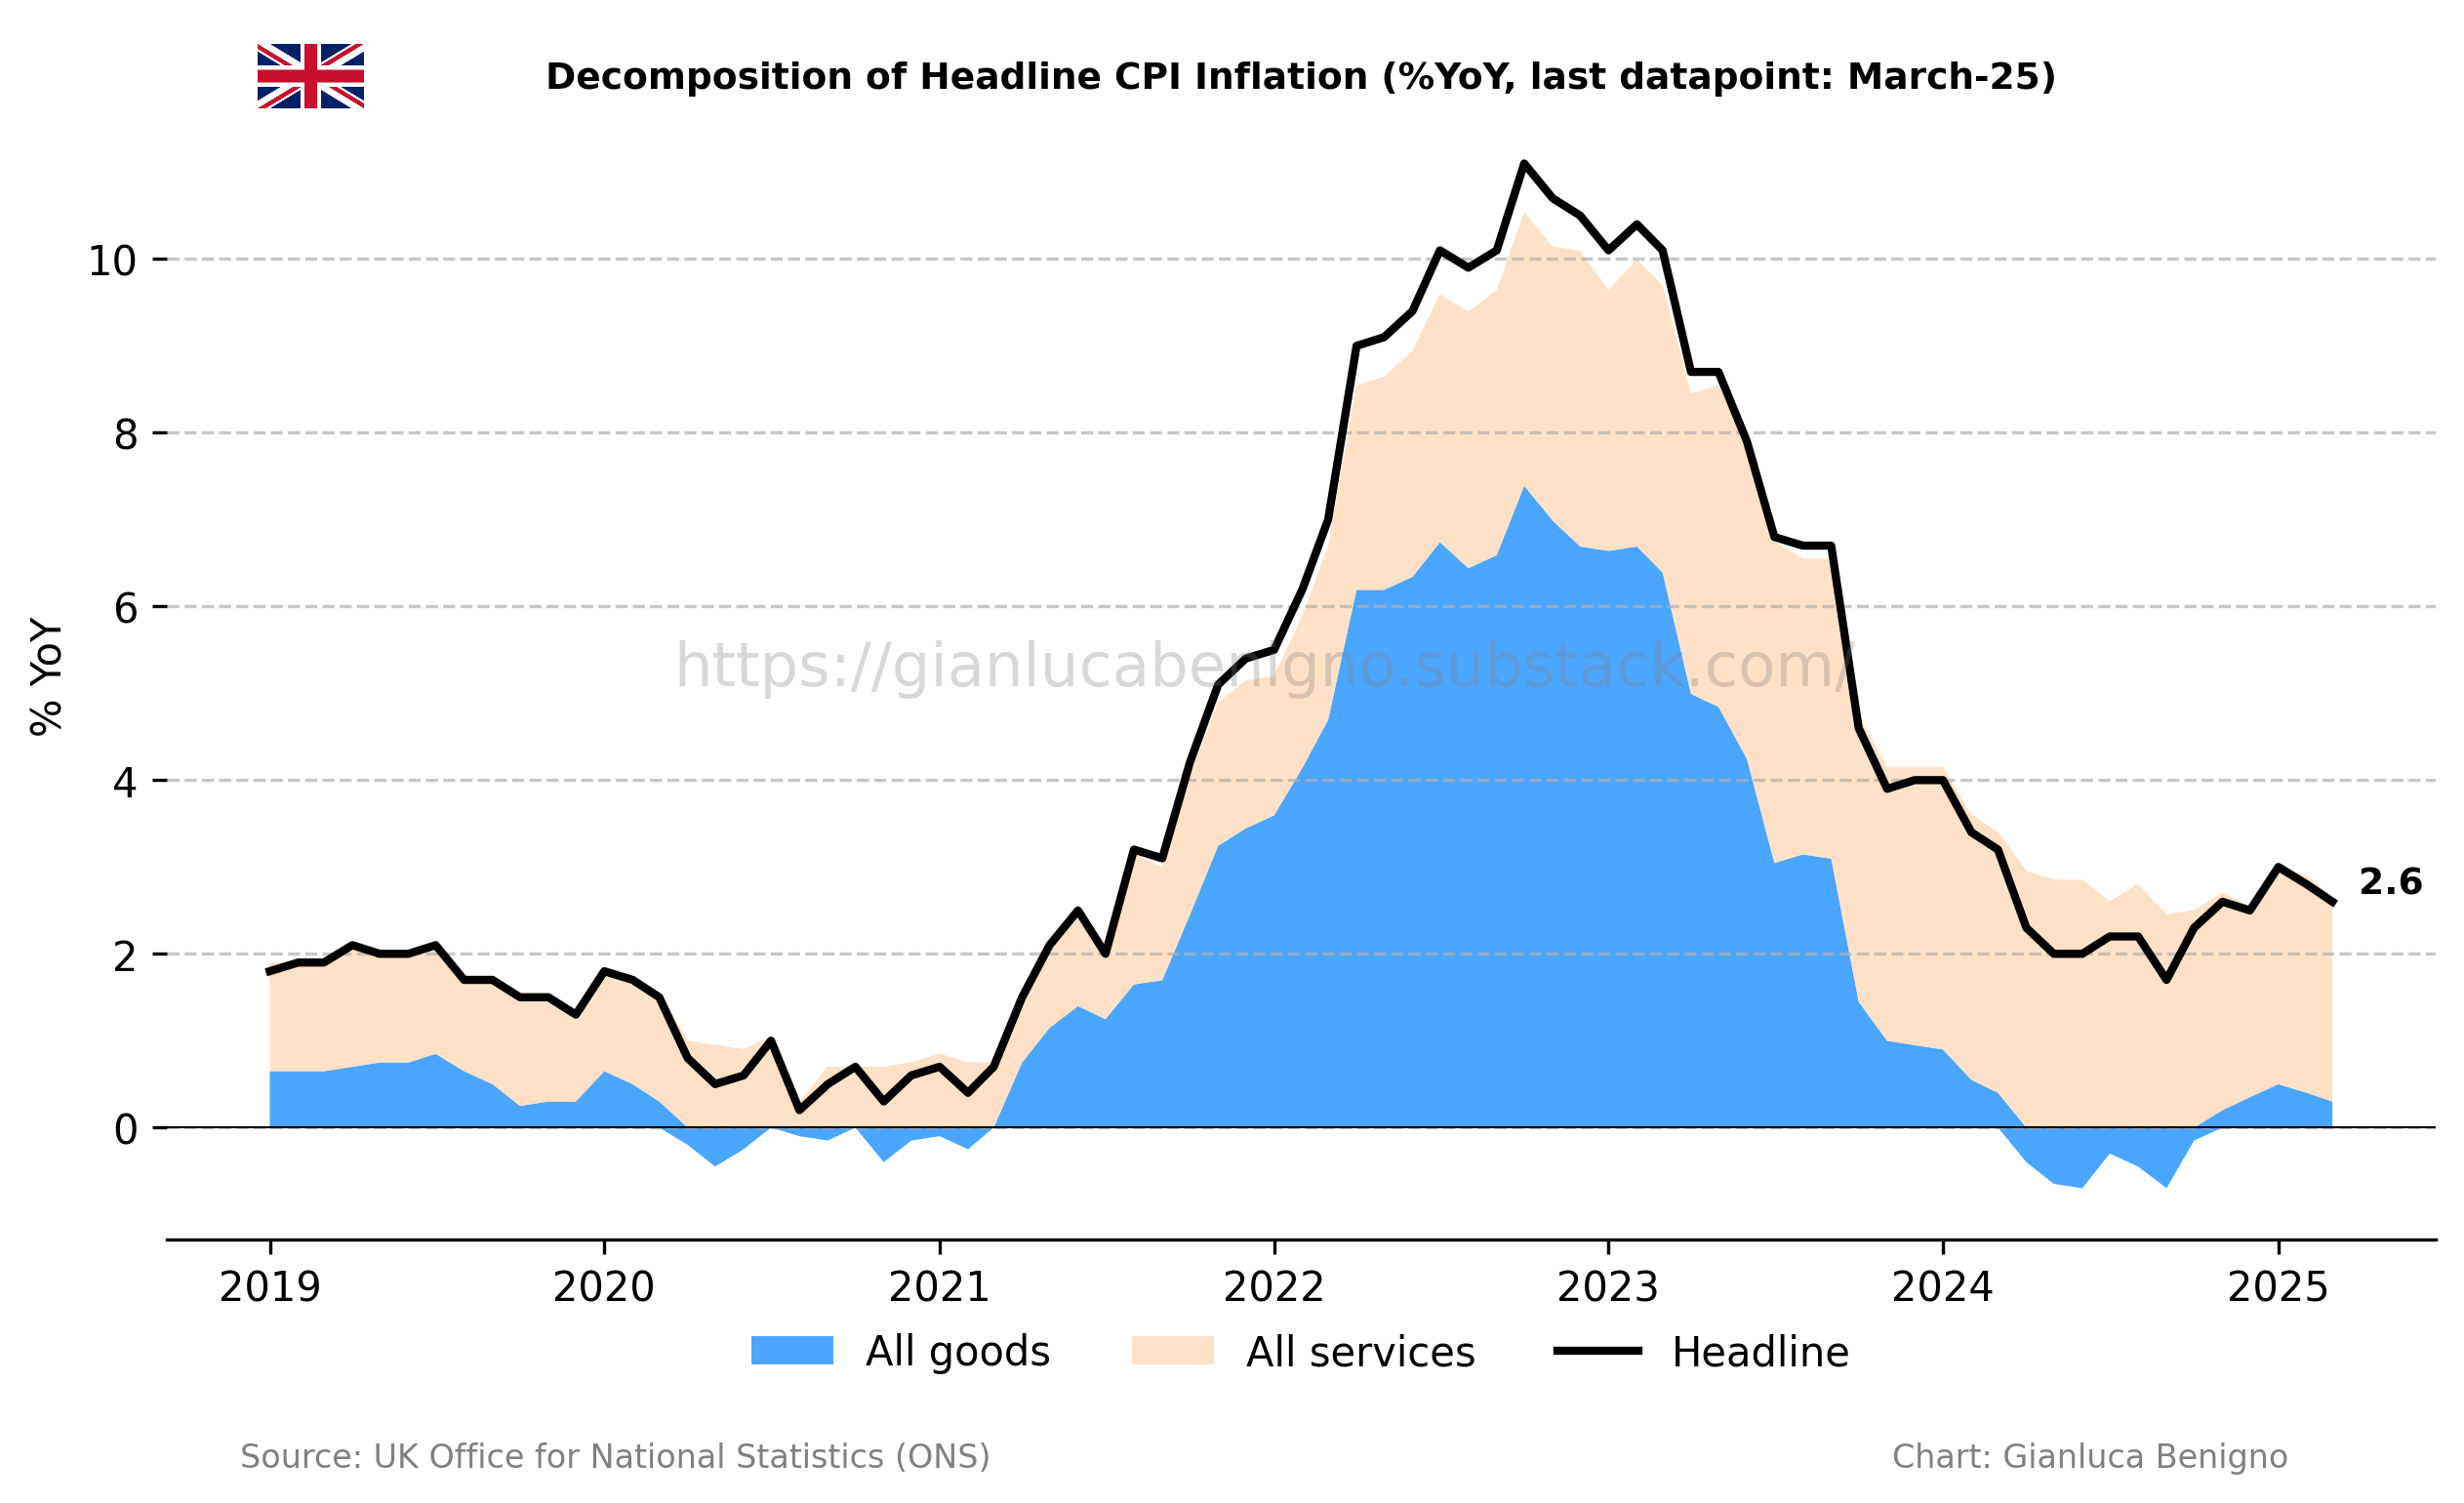
UK Consumer Price Index (CPI) increased by 2.6% year-on-year (YoY) in March, below February’s figure at 2.8% YoY and the market consensus of 2.7% YoY.
Core CPI in March increased by 3.4% YoY, in line with the consensus forecast of 3.4% YoY and below February’s figure of 3.5% YoY.
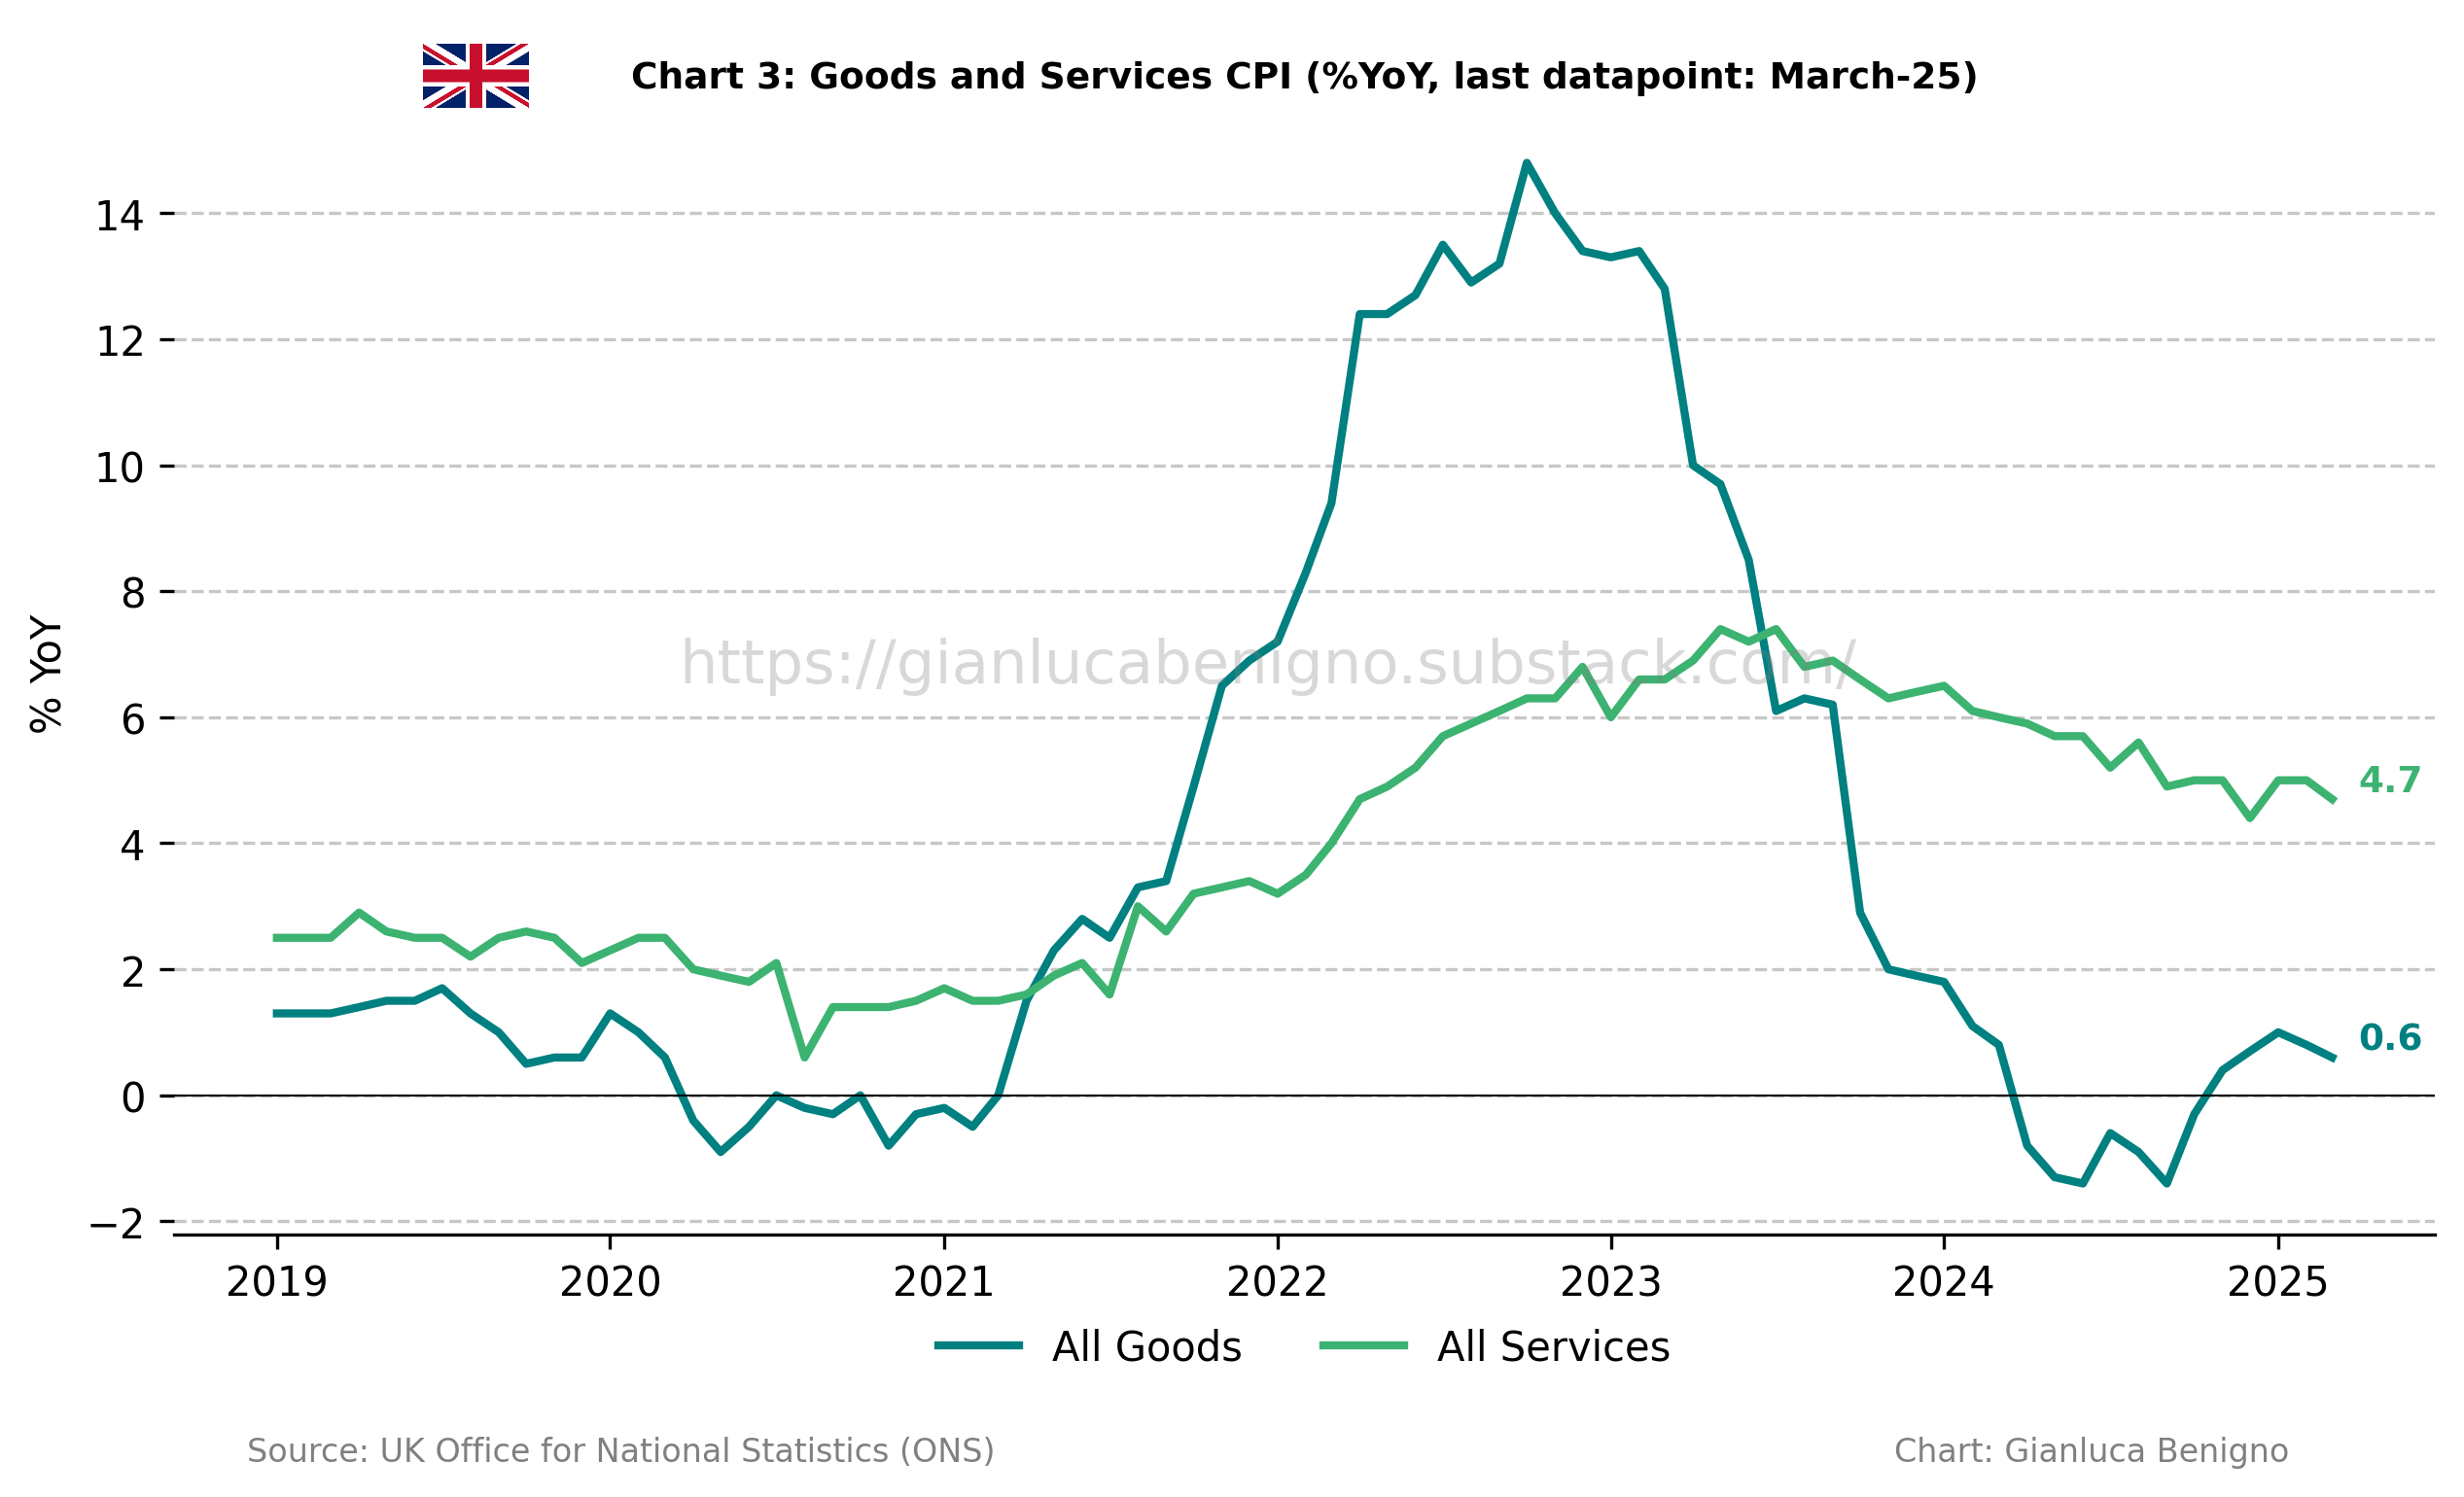
Consistent with the trend in other advanced economies, inflationary pressures remain primarily concentrated in the services sector, which saw an increase of 4.7% YoY in March, below February’s 5.0% YoY increase. Meanwhile, inflation in the goods sector has been out of deflationary territory for the fifth consecutive month, rising 0.6% YoY in March, following February’s increase of 0.8% YoY.
Within services, persistently higher housing costs remain the main driver of inflation. In March, actual rents for housing increased by 7.2% YoY (versus 7.4% YoY in February, 7.8% YoY in January, and 7.6% YoY in December 2024). The data suggest that this component peaked in January 2025 and has since decelerated. This is corroborated by the monthly figures: housing costs rose by 0.2% month-on-month in March, following a 0.3% increase in February and a 0.7% rise in January.
Our supercore service inflation (which removes actual rents for housing from services CPI) increased by 3.8% YoY in March, a significant improvement compared to February’s 4.5% YoY increase.
There is still persistence in wage growth, both in aggregate figures and in our supercore measures: both measures are still running well above 5% YoY.
The next BOE policy decision is scheduled for May 8th. Markets currently assign a high probability to a 25bps cut, largely attributed to a softening labor market and renewed trade policy uncertainty—particularly regarding the UK’s relationship with the U.S.. The latest release points to an improving inflation outlook; however, looking ahead, the effects of tariffs and index-linked price adjustments will be critical in shaping the trajectory of inflation through 2025 and possibly affecting the monetary policy outlook.
Related posts (with links)
UK February-25 CPI Inflation Report (previous release);
UK January-25 CPI Inflation Report (previous release);
UK December-24 CPI Inflation Report (previous release);
UK November-24 CPI Inflation Report (previous release);
The Bank of England at a Crossroads: Rethinking the Narrative Before It’s Too Late? (related post);
Scenario Analysis as Communication Device for Central Banking (related post);
A Quasi-Global Inflation Overview (related post);
Has Wage Growth Fueled Inflation in the UK? (related post);
At the Core of UK Inflation (construction of supercore inflation and supercore wage index);
FT Alphaville on Catch-22 (short version of the Catch-22 effect);
Is the Bank of England in a Catch-22 Situation (long version of the Catch-22 effect);
Review of the Inflation Release

In March 2025, consumer prices increased by 2.6% year-on-year (YoY), lower than the market consensus of 2.7% and February’s figure of 2.8% YoY. On a month-on-month (MoM) basis, consumer prices increased by 0.3%, lower than the 0.4% MoM increase recorded in February.
Core CPI, which excludes food and energy, rose by 3.4% YoY, in line with the consensus forecast of 3.4% YoY and below February’s 3.5% YoY increase (see Charts 1 and 2). On a month-on-month basis, core CPI increased by 0.5%, higher than the 0.4% MoM increase recorded in February.

The services sector remains the primary driver of inflation, with an increase of 4.7% YoY in March compared to 5.0% YoY in February. On a monthly basis, service inflation increased by 0.4% MoM, lower than the 0.5% MoM increase observed in March. The goods sector inflation showed a 0.6% YoY increase in March, lower than the 0.8% increase observed in February. On a month-on-month basis, goods inflation increased by 0.3% MoM compared to February’s 0.4% MoM increase. Chart 3 highlights the persistence of service inflation and the recent uptick in goods price inflation, which is now adding to overall inflation rather than offsetting it, as it did for most of 2024.
A distinctive feature of inflation developments in the UK has been the ongoing rise in housing inflation (what we refer to as the “Catch-22” effect), which has been the primary driver of inflationary pressures (Table 1). Actual rents for housing rose by 7.2% YoY – compared to February’s 7.4% YoY increase and January’s 7.8% YoY increase – reversing partly the upward trend of housing prices seen since September 2021, a tail-end effect of the "higher for longer" rates in the UK. On a month-to-month basis, actual rents rose by 0.2% MoM, compared to 0.3% MoM in February and 0.7% MoM in January.
Overall, first-quarter data indicate that housing costs likely peaked in January 2025, suggesting a gradual deceleration in housing inflation over the remainder of the year.

In this context, we’ve also updated our supercore wage index following the release of nominal wage data (Chart 5). As can be seen, there was an increase of 6.4% YoY in February, the same as January’s 6.4% YoY increase. Overall wages have also increased by 5.6% YoY, slightly lower than the 5.7% YoY (n.s.a.) increase observed in January.

Policy Implications
At its March 20th meeting, the Bank of England (BoE) maintained its policy rate at 4.5%, with an 8–1 vote by the Monetary Policy Committee (MPC). While inflation continues to ease, the Committee opted to remain on hold, reflecting lingering concerns around wage dynamics, external risks, and the durability of disinflation.
Attention now turns to the May 8th policy decision. With a softening labor market and trade-related uncertainty weighing on the outlook, markets have increasingly priced in a 25-bps rate cut as the most likely next step. The MPC has reaffirmed its commitment to a “gradual and careful approach.” While the current release is a welcome development, the outlook for inflation in 2025 remains uncertain, given the prospective impact of index-linked price adjustments—such as council tax, energy, and water bills—as well as the effects of new tariffs.
Table 1: CPI by components (% YoY)

Source: UK Office of National Statistics (ONS)
Table 2: CPI by components (% MoM)

Source: UK Office of National Statistics (ONS).
Gianluca, is the persistence in rent inflation, albeit decelerating, a greater problem for UK given that is often a larger share of spend than CPI baskets suggest? Same question for US. Thx