


US May-25 CPI Inflation report
There are no signs yet of tariff-induced inflation, and the data continue to reflect the slow disinflationary process that was already in place before the tariffs were introduced.

Key takeaways:
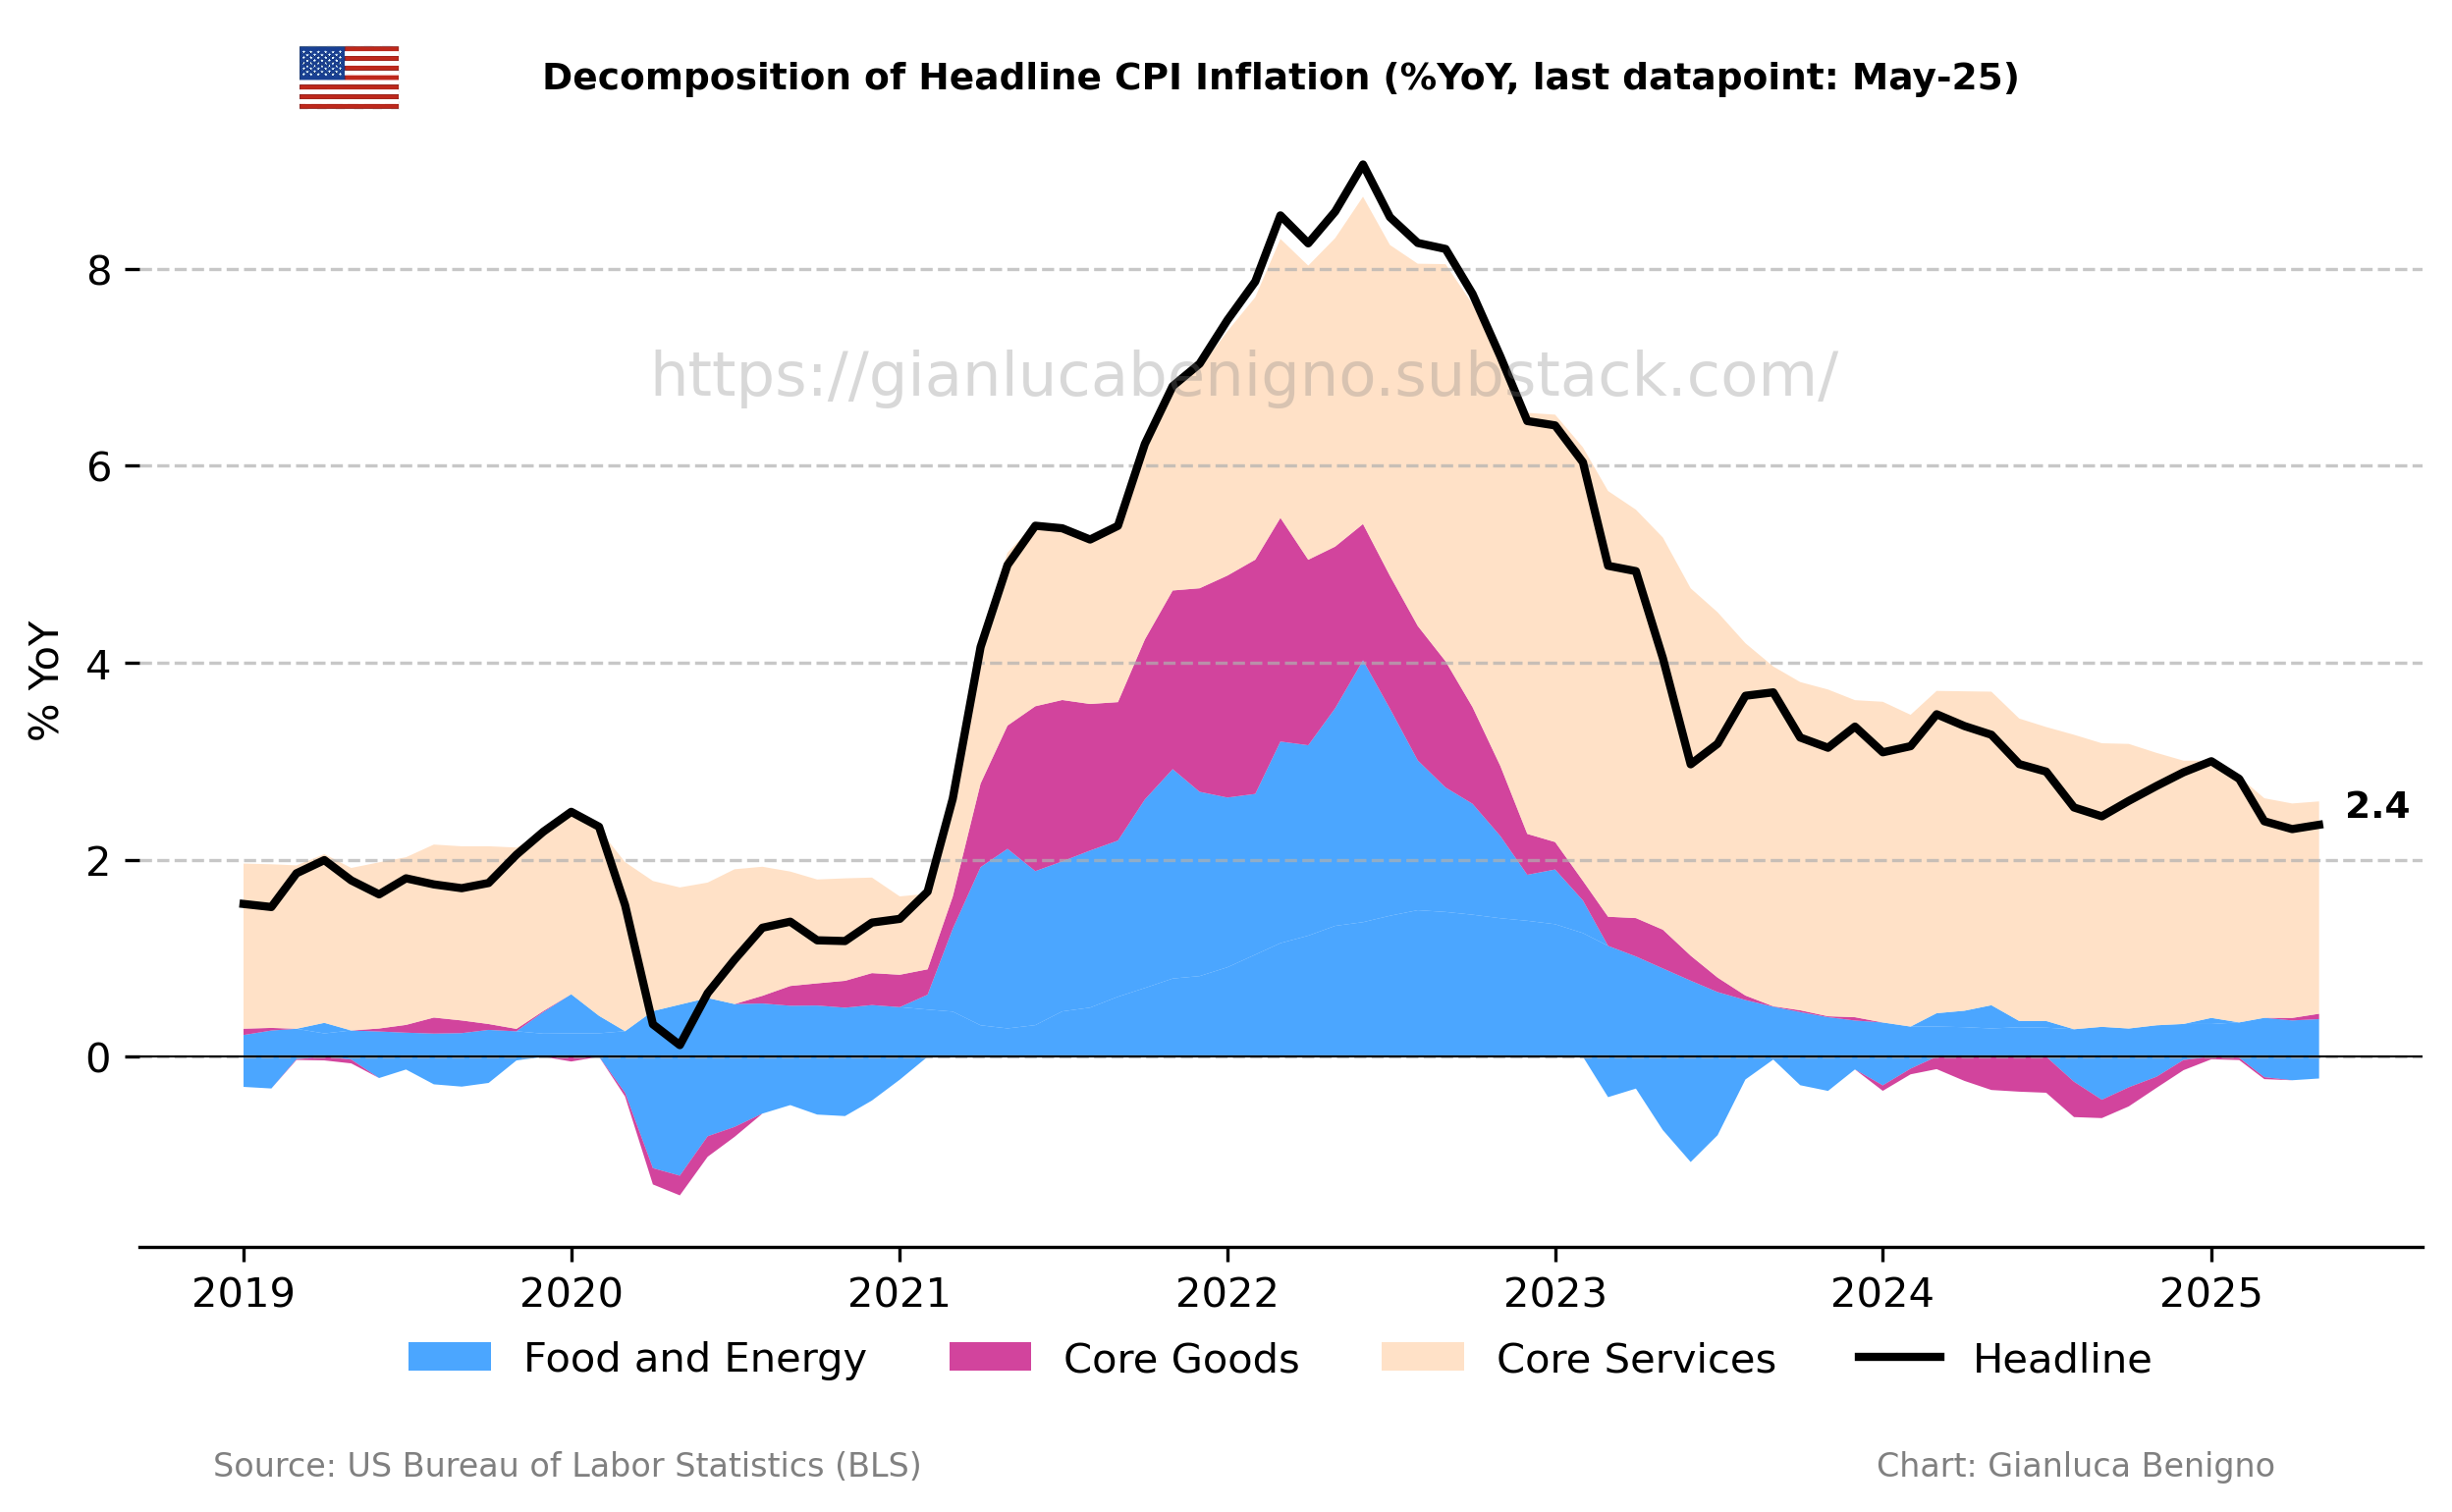
The overall Consumer Price Index (CPI, n.s.a.) increased by 2.4% year-on-year (YoY) in May, below the consensus expectation of 2.5% YoY and just above April’s reading of 2.3% YoY.
Core CPI in May was 2.8% YoY (n.s.a.), in line with April’s reading of 2.8% YoY and below the consensus forecast of 2.9% YoY.
Inflationary pressures are primarily concentrated in the core service sector, with an increase of 3.6% YoY in May, the same increase as in April. In contrast, the core goods sector (ex-energy and food) experienced an increase of 0.3% YoY, compared to April’s 0.1% YoY increase.
The primary factor behind recent inflationary pressures is still the rent of shelter component of the Consumer Price Index (CPI). Rent of shelter increased by 3.9% YoY in May, lower than the 4.0% YoY recorded in April. The month-on-month increase was 0.3% MoM (n.s.a.), the same monthly change as in April.
The slow adjustment of core service inflation and its housing component are the key factors behind the slow adjustment towards the 2% target. Nonetheless, this release offers a promising signal of continued improvement. This now marks the third time since 2022 that year-over-year services inflation has fallen below 4.0%. The monthly reading, though, rose by 0.3% MoM (n.s.a.) in May, the same monthly increase as in April.
This inflation report is consistent with the gradual disinflationary trend observed in recent months. Despite the tariffs imposed on Canada, China, and Mexico before April, the current data show no significant pickup in goods inflation or its subcomponents, suggesting that, so far, the impact of tariffs has not materialized at the CPI level.
This report reinforces the wait-and-see approach adopted by the majority of FOMC participants, strengthening the case for keeping rates on hold as they await clearer signs of how the recent tariffs will feed through to inflation.
Related Posts
U.S. April-25 CPI Inflation Report (previous release)
U.S. March-25 CPI Inflation Report (previous release)
U.S. February-25 CPI Inflation Report (previous release)
U.S. January-25 CPI Inflation Report (previous release)
U.S. December-24 CPI Inflation Report (previous release)
U.S. November-24 CPI Inflation Report (previous release)
50 or 25 bps? The cut that could split the Fed (context post);
Post FOMC update: the Fed and the Market Shifts (context post);
Scenario Analysis as a Communication Device for Central Banking (related post).
Review of the Inflation Release
In May 2025, the Consumer Price Index (CPI) rose by 2.4% (n.s.a.) year-on-year (YoY) (Chart 1), below the market consensus at 2.5% YoY and above April’s figure of 2.3% YoY. On a month-on-month basis (MoM), CPI increased by 0.2% MoM (n.s.a.), compared to the 0.3% MoM increase recorded in April. The seasonally adjusted monthly change was 0.1% MoM.
Core CPI (excluding food and energy) increased by 2.8% year-on-year in May (Chart 1), below the market consensus at 2.9% YoY and in line with April’s figure at 2.8% YoY. On a month-on-month basis, core CPI increased by 0.2% MoM (n.s.a.), in contrast to April’s 0.3% MoM increase. On a seasonally adjusted basis, the increase was at 0.1% MoM, down from the 0.2% MoM increase recorded in April.

Core services (services excluding energy) remain the primary driver of inflationary pressures. In May, core services increased by 3.6% YoY, the same increase as in April, while core goods (goods excluding food and energy) experienced an increase of 0.3% YoY, above the 0.1% MoM rise recorded in April. The current release confirms the slow disinflationary trend in core services (now firmly below 4.0% YoY).
Despite the downward trend in services inflation, Chart 2 illustrates the contrast between core goods and core services, which is still common to many advanced countries (except for Japan). What’s particularly noteworthy is that goods inflation has now begun to contribute positively to overall inflation—a shift that, in principle, should be reinforced by the imposition of tariffs.

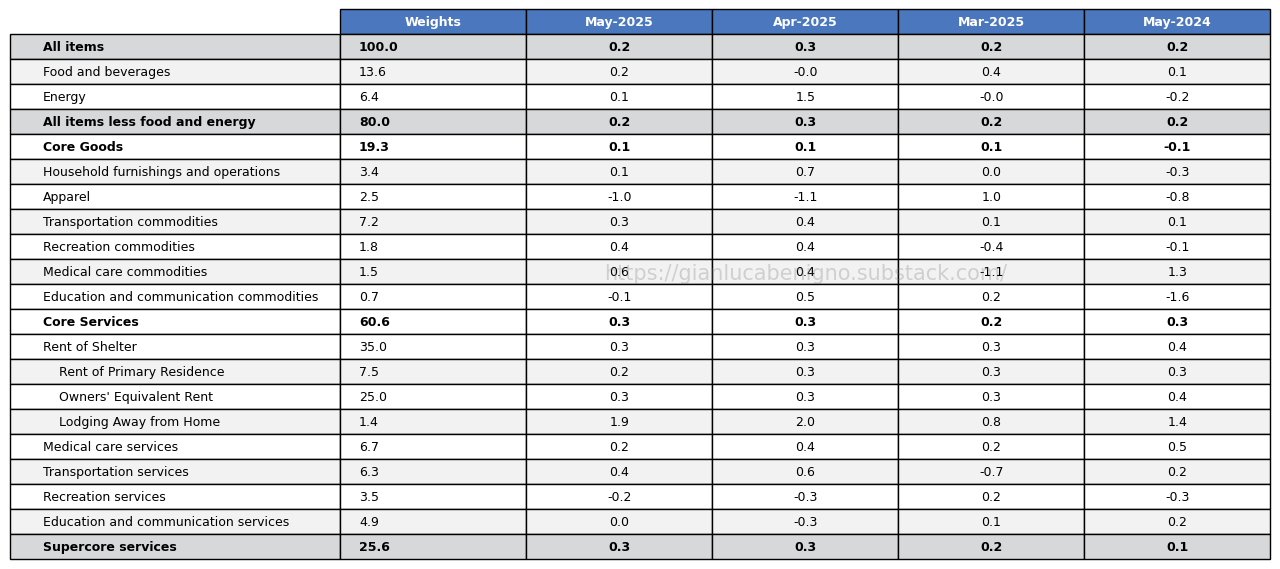
As for past reports, CPI in May was primarily driven by the housing component (Tables 1 and 2). The rent of shelter components rose by 3.9% YoY in May, below the 4.0% YoY increase recorded in April. Noticeably, the shelter component increased by 0.3% on a month-on-month basis (n.s.a.), the same monthly increase observed in April.
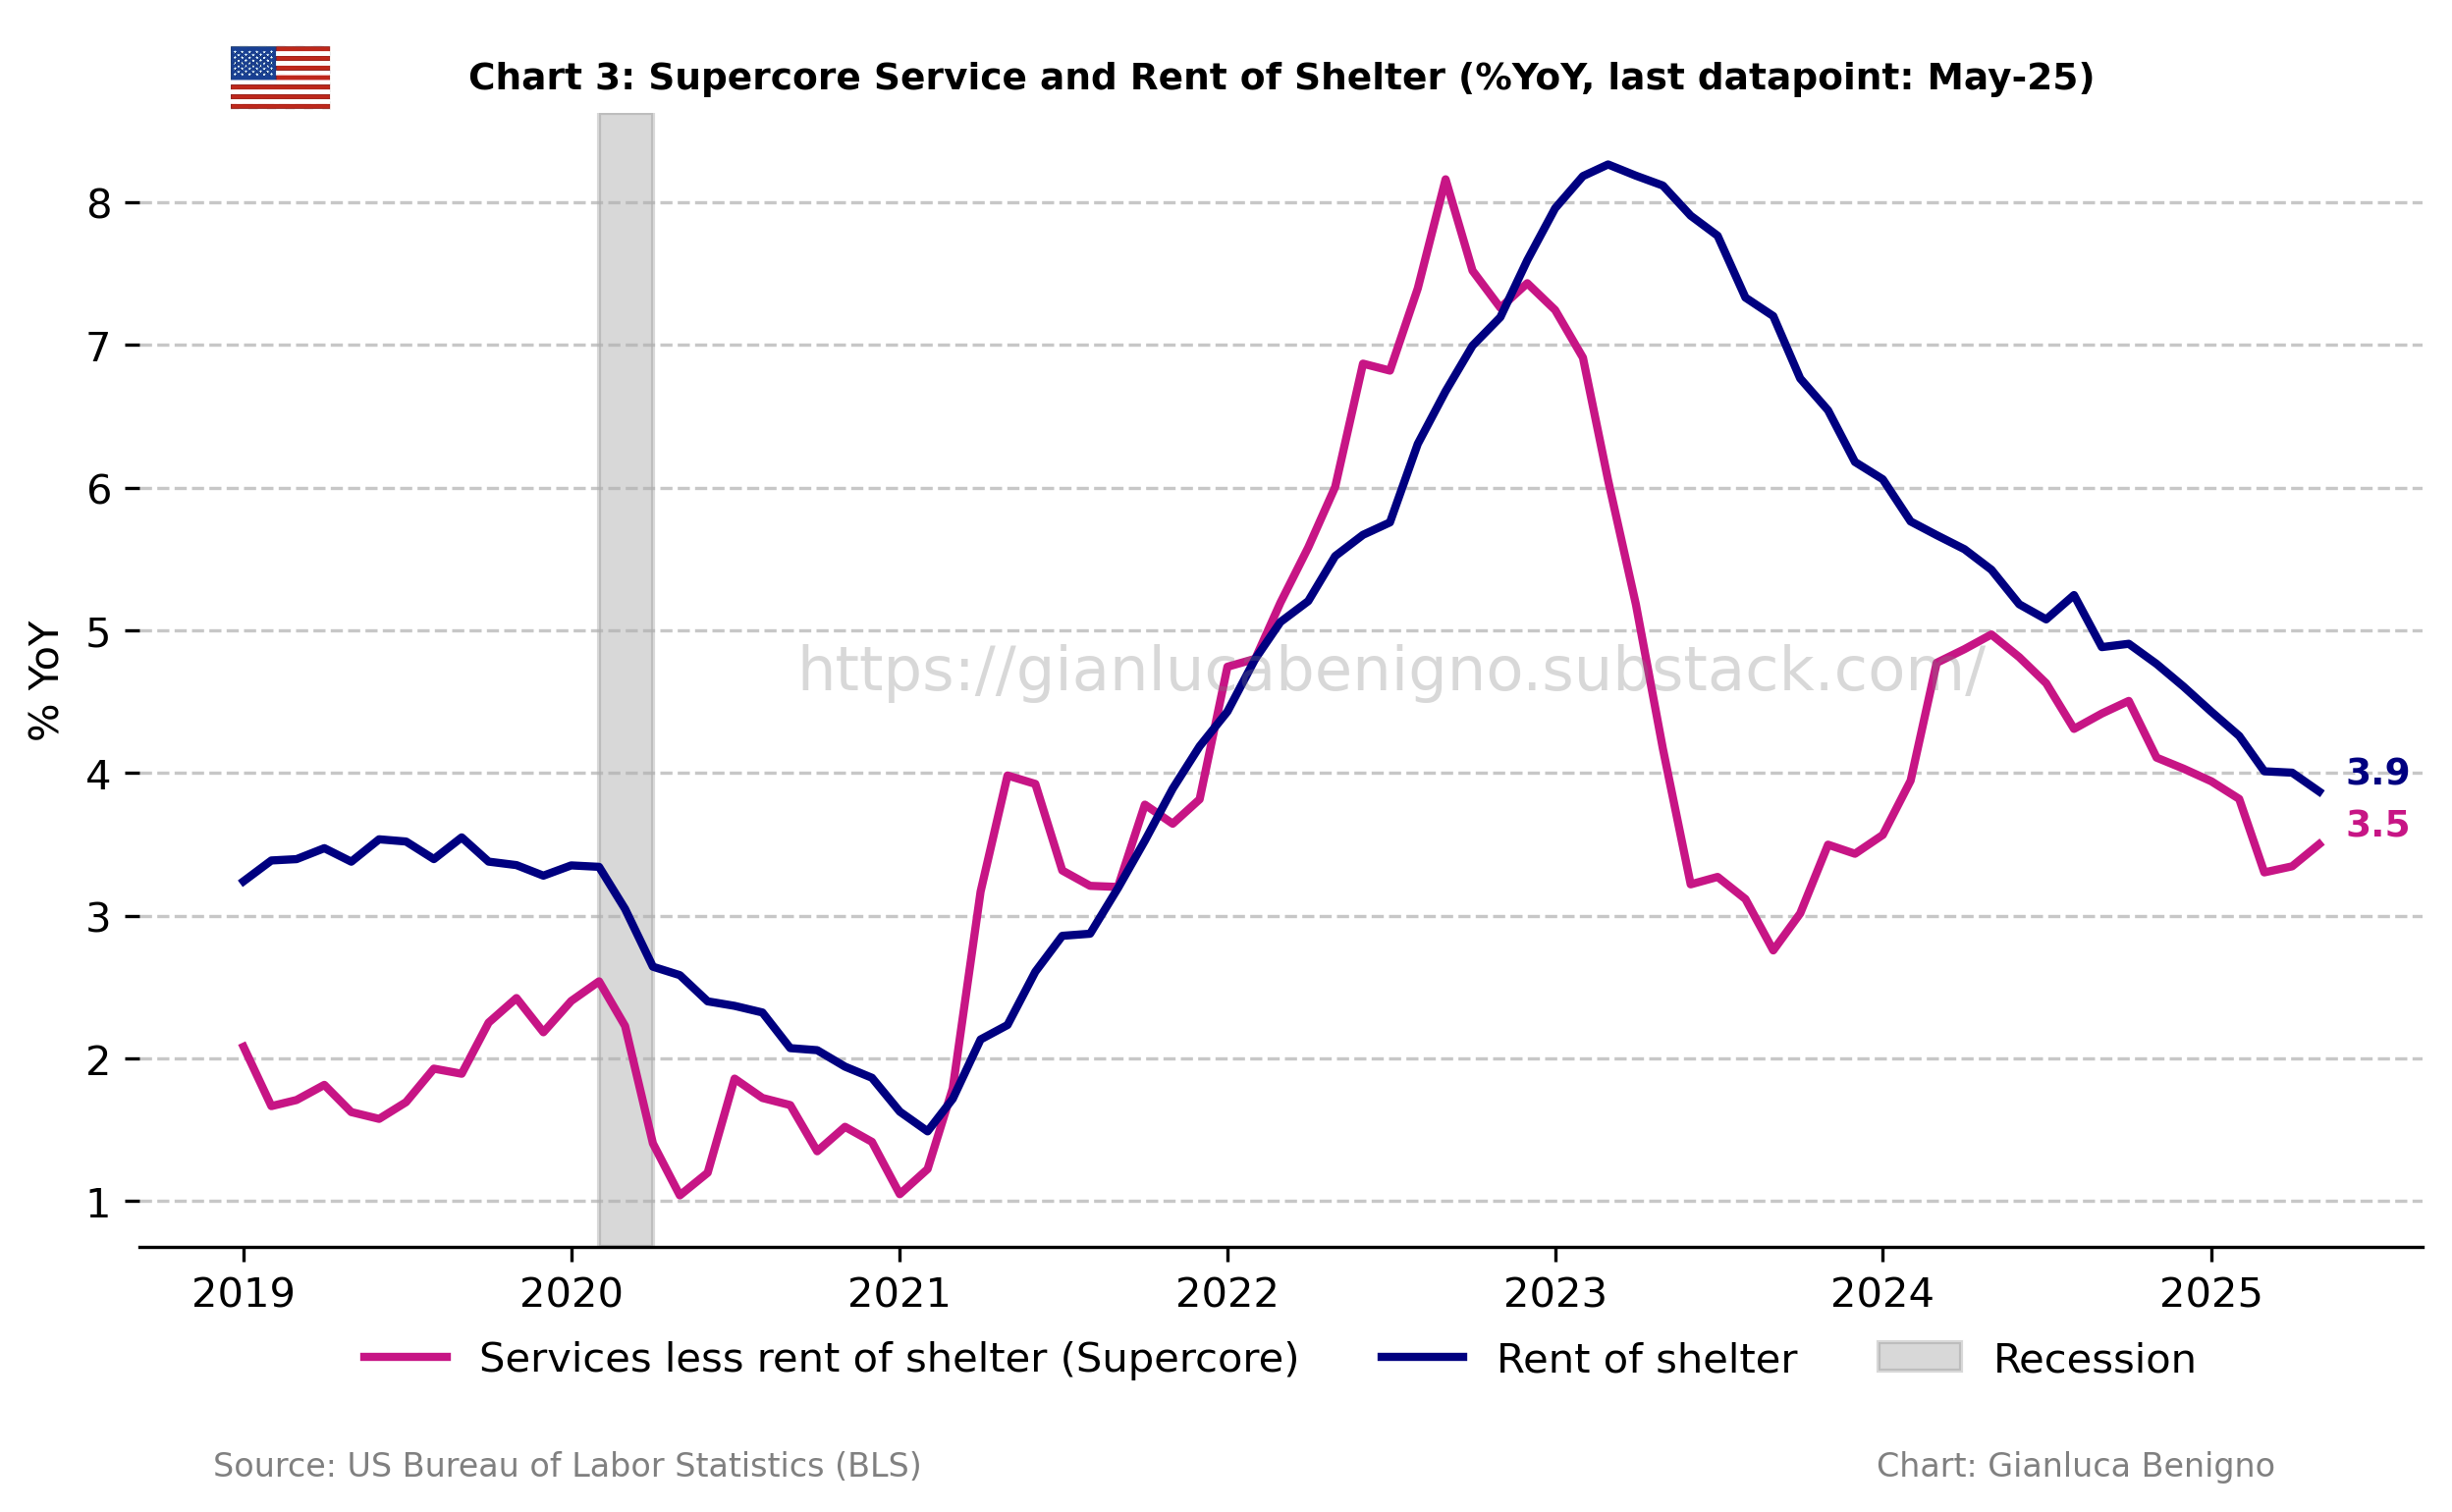
Within this context, supercore services (core services excluding shelter – Chart 3) increased by 3.5% YoY compared to April’s 3.3% YoY increase reading. On a monthly basis, the supercore component increased by 0.3% MoM in May, the same monthly increase recorded in April.
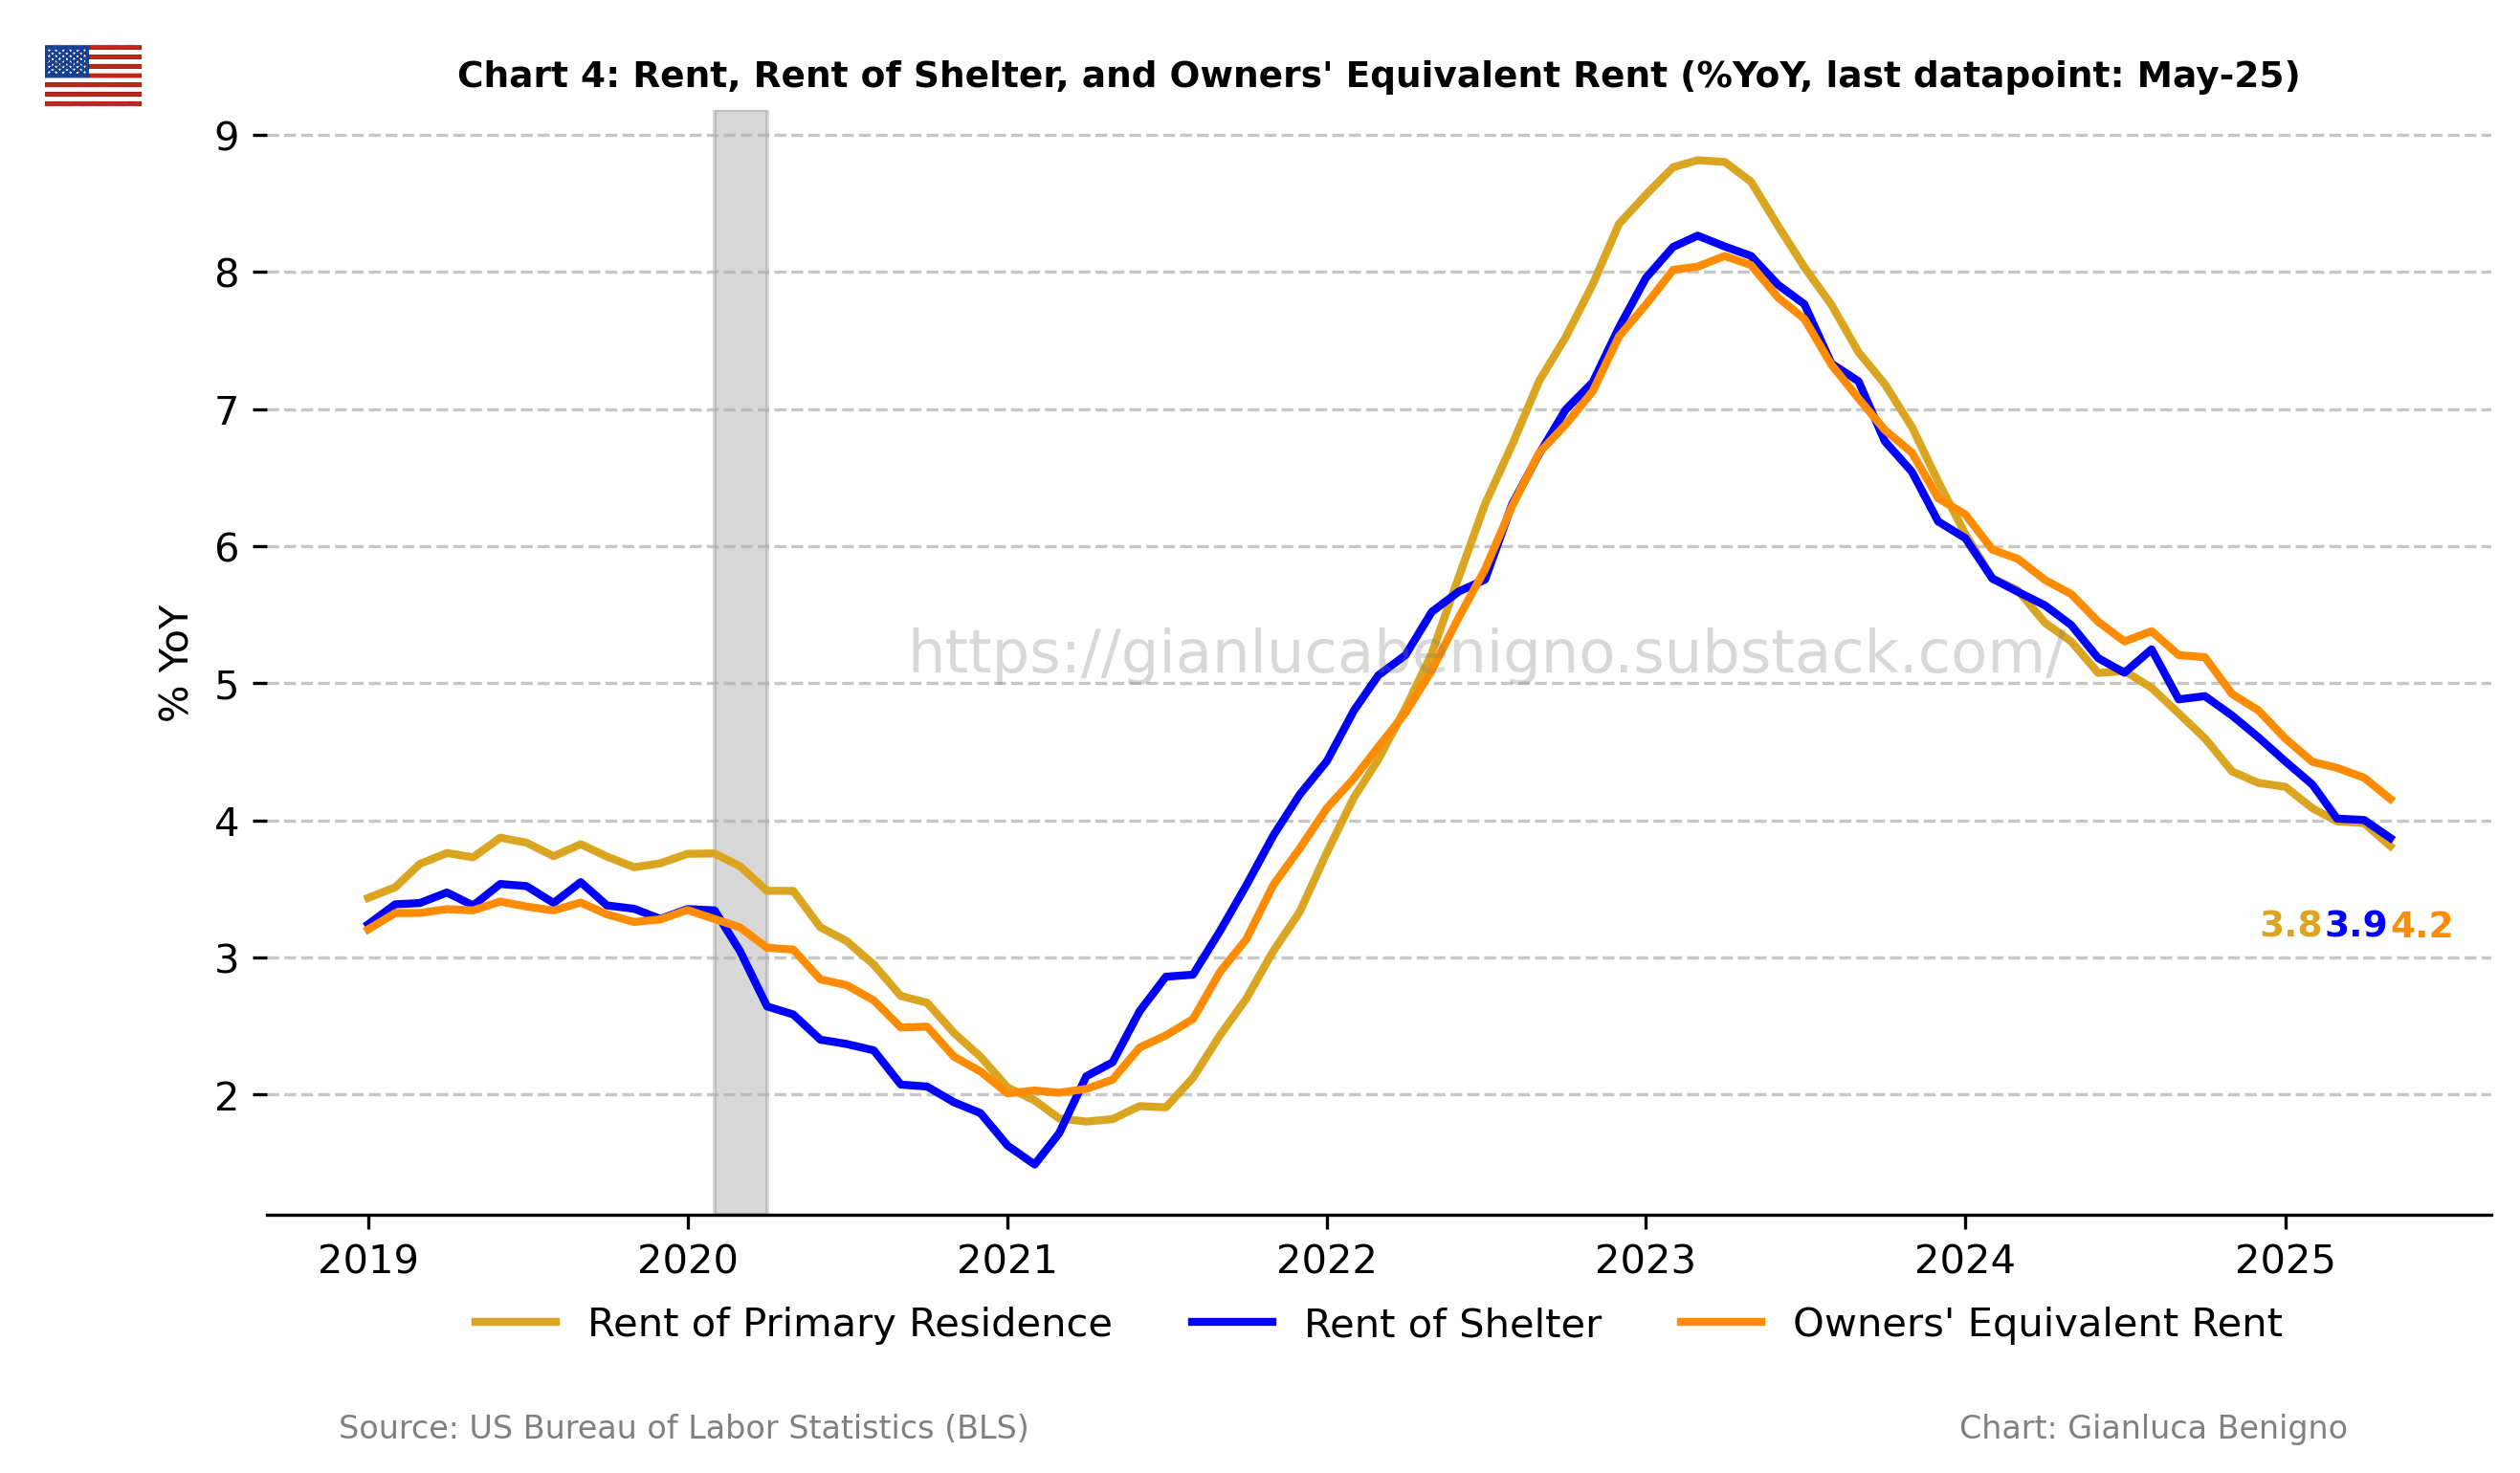
The rent subcomponent of the rent of shelter increased by 3.8% YoY, compared to the 4.0% YoY in April 2025, while the owners’ equivalent rent rose by 4.2% YoY, lower than the 4.3% YoY recorded in April (see Chart 4).
Summary
There are again some encouraging signals in the latest inflation report. Core inflation appears to be stabilizing below 3%, while services inflation has eased below the 4% range. Several key monthly readings point to continued disinflationary momentum.
The current inflation release still does not show any evidence of tariff-related inflationary pressure. May's data could have, in principle, reflected the impact of recently implemented tariffs on Canada, Mexico, and China, but revealed no notable increase in core goods inflation or key underlying categories. These early-stage tariffs (announced in January-February-March) have yet to translate into measurable price effects at the CPI level.
From a monetary policy perspective, this inflation reading is unlikely to influence the FOMC’s decision next week, as the Federal Reserve is widely expected to keep rates unchanged. Many FOMC participants are currently adopting a wait-and-see approach, anticipating that the recent tariff shock could have a stagflationary effect on the U.S. economy. It will be of interest to see how this outlook is reflected in the updated Summary for Economic Projections for inflation and GDP growth through the end of 2025, as well as in the implied path of interest rates.
Table 1: CPI by components (% YoY)

Source: Bureau of Labor Statistics (BLS).
Table 2: CPI by components (% MoM)
Source: Bureau of Labor Statistics (BLS)
Thanks for your comment—you raise a very important point. First, there’s the implicit issue of timing: the lag between the implementation of tariffs and their impact on prices. If businesses are still working through pre-tariff inventories, the immediate pass-through to consumer prices could indeed be delayed.
That said, there are still factors that may lead to earlier price effects. Even if current inventories were sourced before tariffs, some firms may raise prices preemptively in anticipation of higher replacement costs, especially if competitors do the same. Additionally, pricing strategies may adjust based on expectations that tariffs will eventually be enforced, even if currently postponed.
Second, if I understand your question correctly, you're suggesting that inventories might still be in place when negotiations conclude. If that's the case—and if the outcome involves only limited tariffs—then the overall impact on inflation could be minimal. That’s certainly a plausible scenario.
We'll know more after July 9th, once we see which trade agreements are reached and the specific terms involved.
Let’s assume that businesses are still working on their pre-tariffs inventory, is it too much optimism to say these inventories will still be in place right after tariffs negotiations have concluded? Given that tariffs implementation was postponed?
What tariffs inflation are some expecting? I’m I missing something?