


UK April-25 CPI Inflation Report
Headline CPI rose as regulated price increases took effect. More notably, there was a surprise uptick in services inflation, which climbed to 5.4%.

Key takeaways:
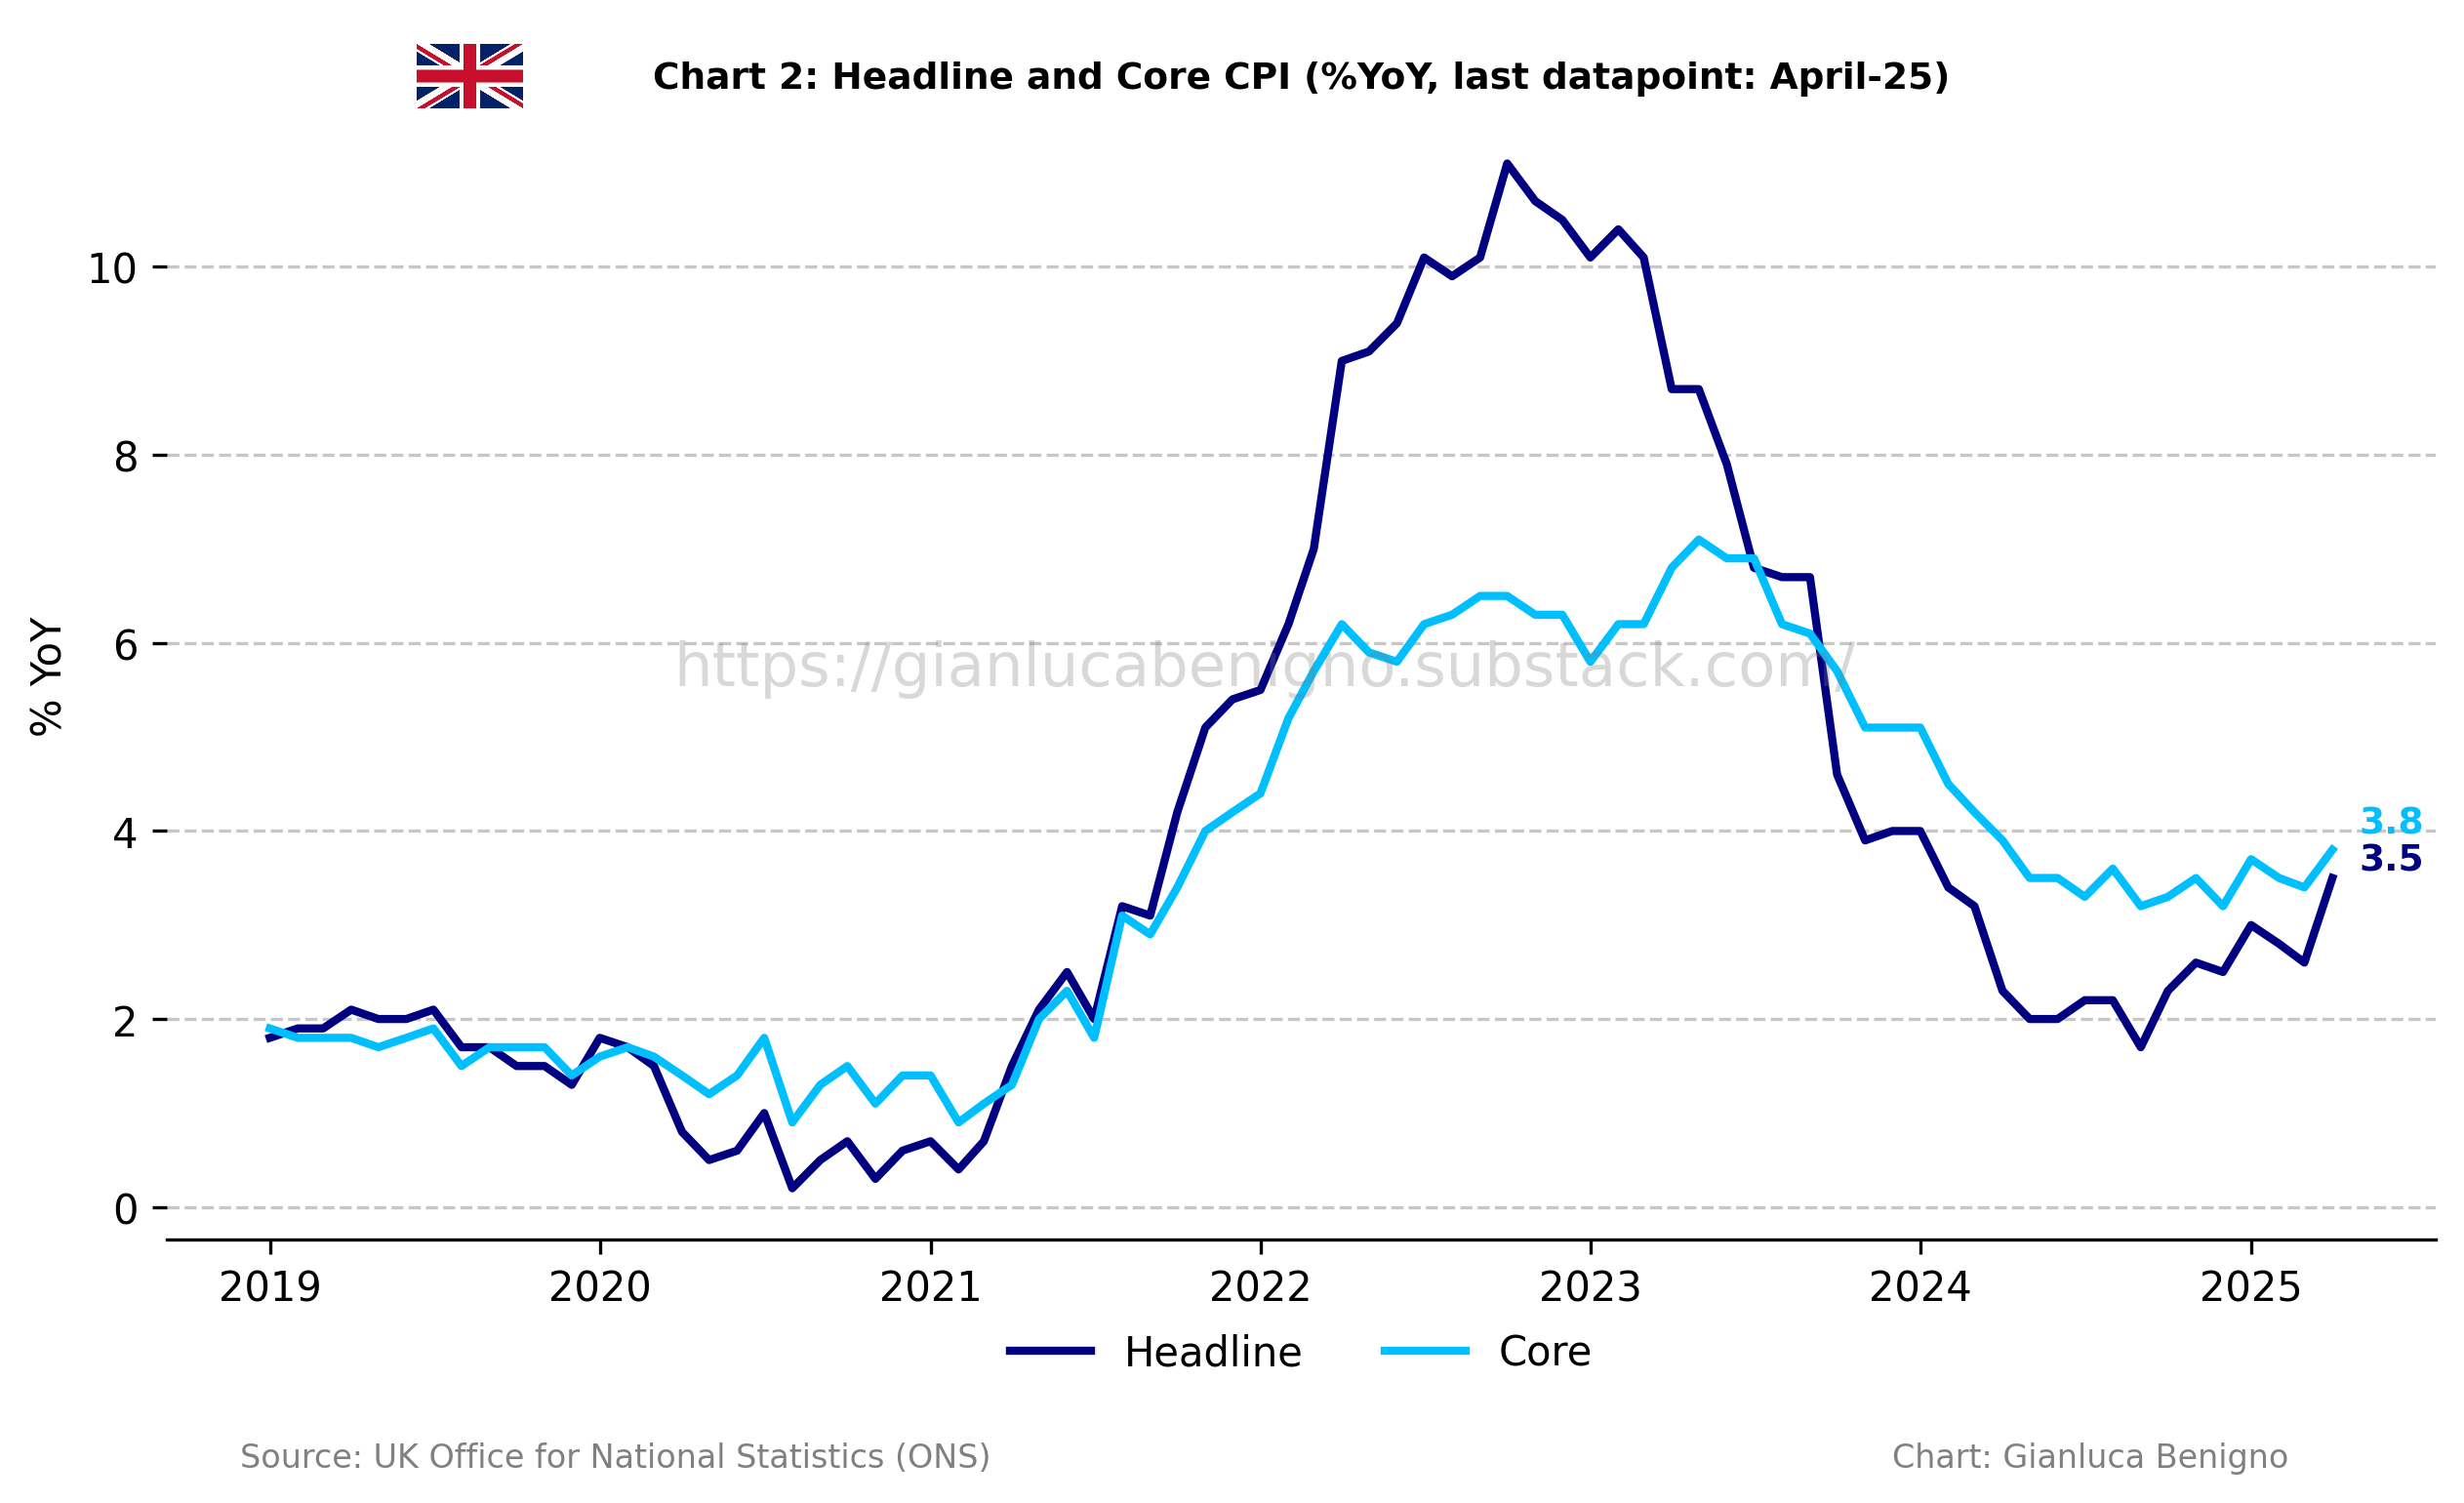
UK Consumer Price Index (CPI) increased by 3.5% year-on-year (YoY) in April, above March’s figure at 2.6% YoY, and the market consensus of 3.3% YoY.
Core CPI in April increased by 3.8% YoY, above the consensus forecast of 3.6% YoY, and above March’s figure of 3.4% YoY.
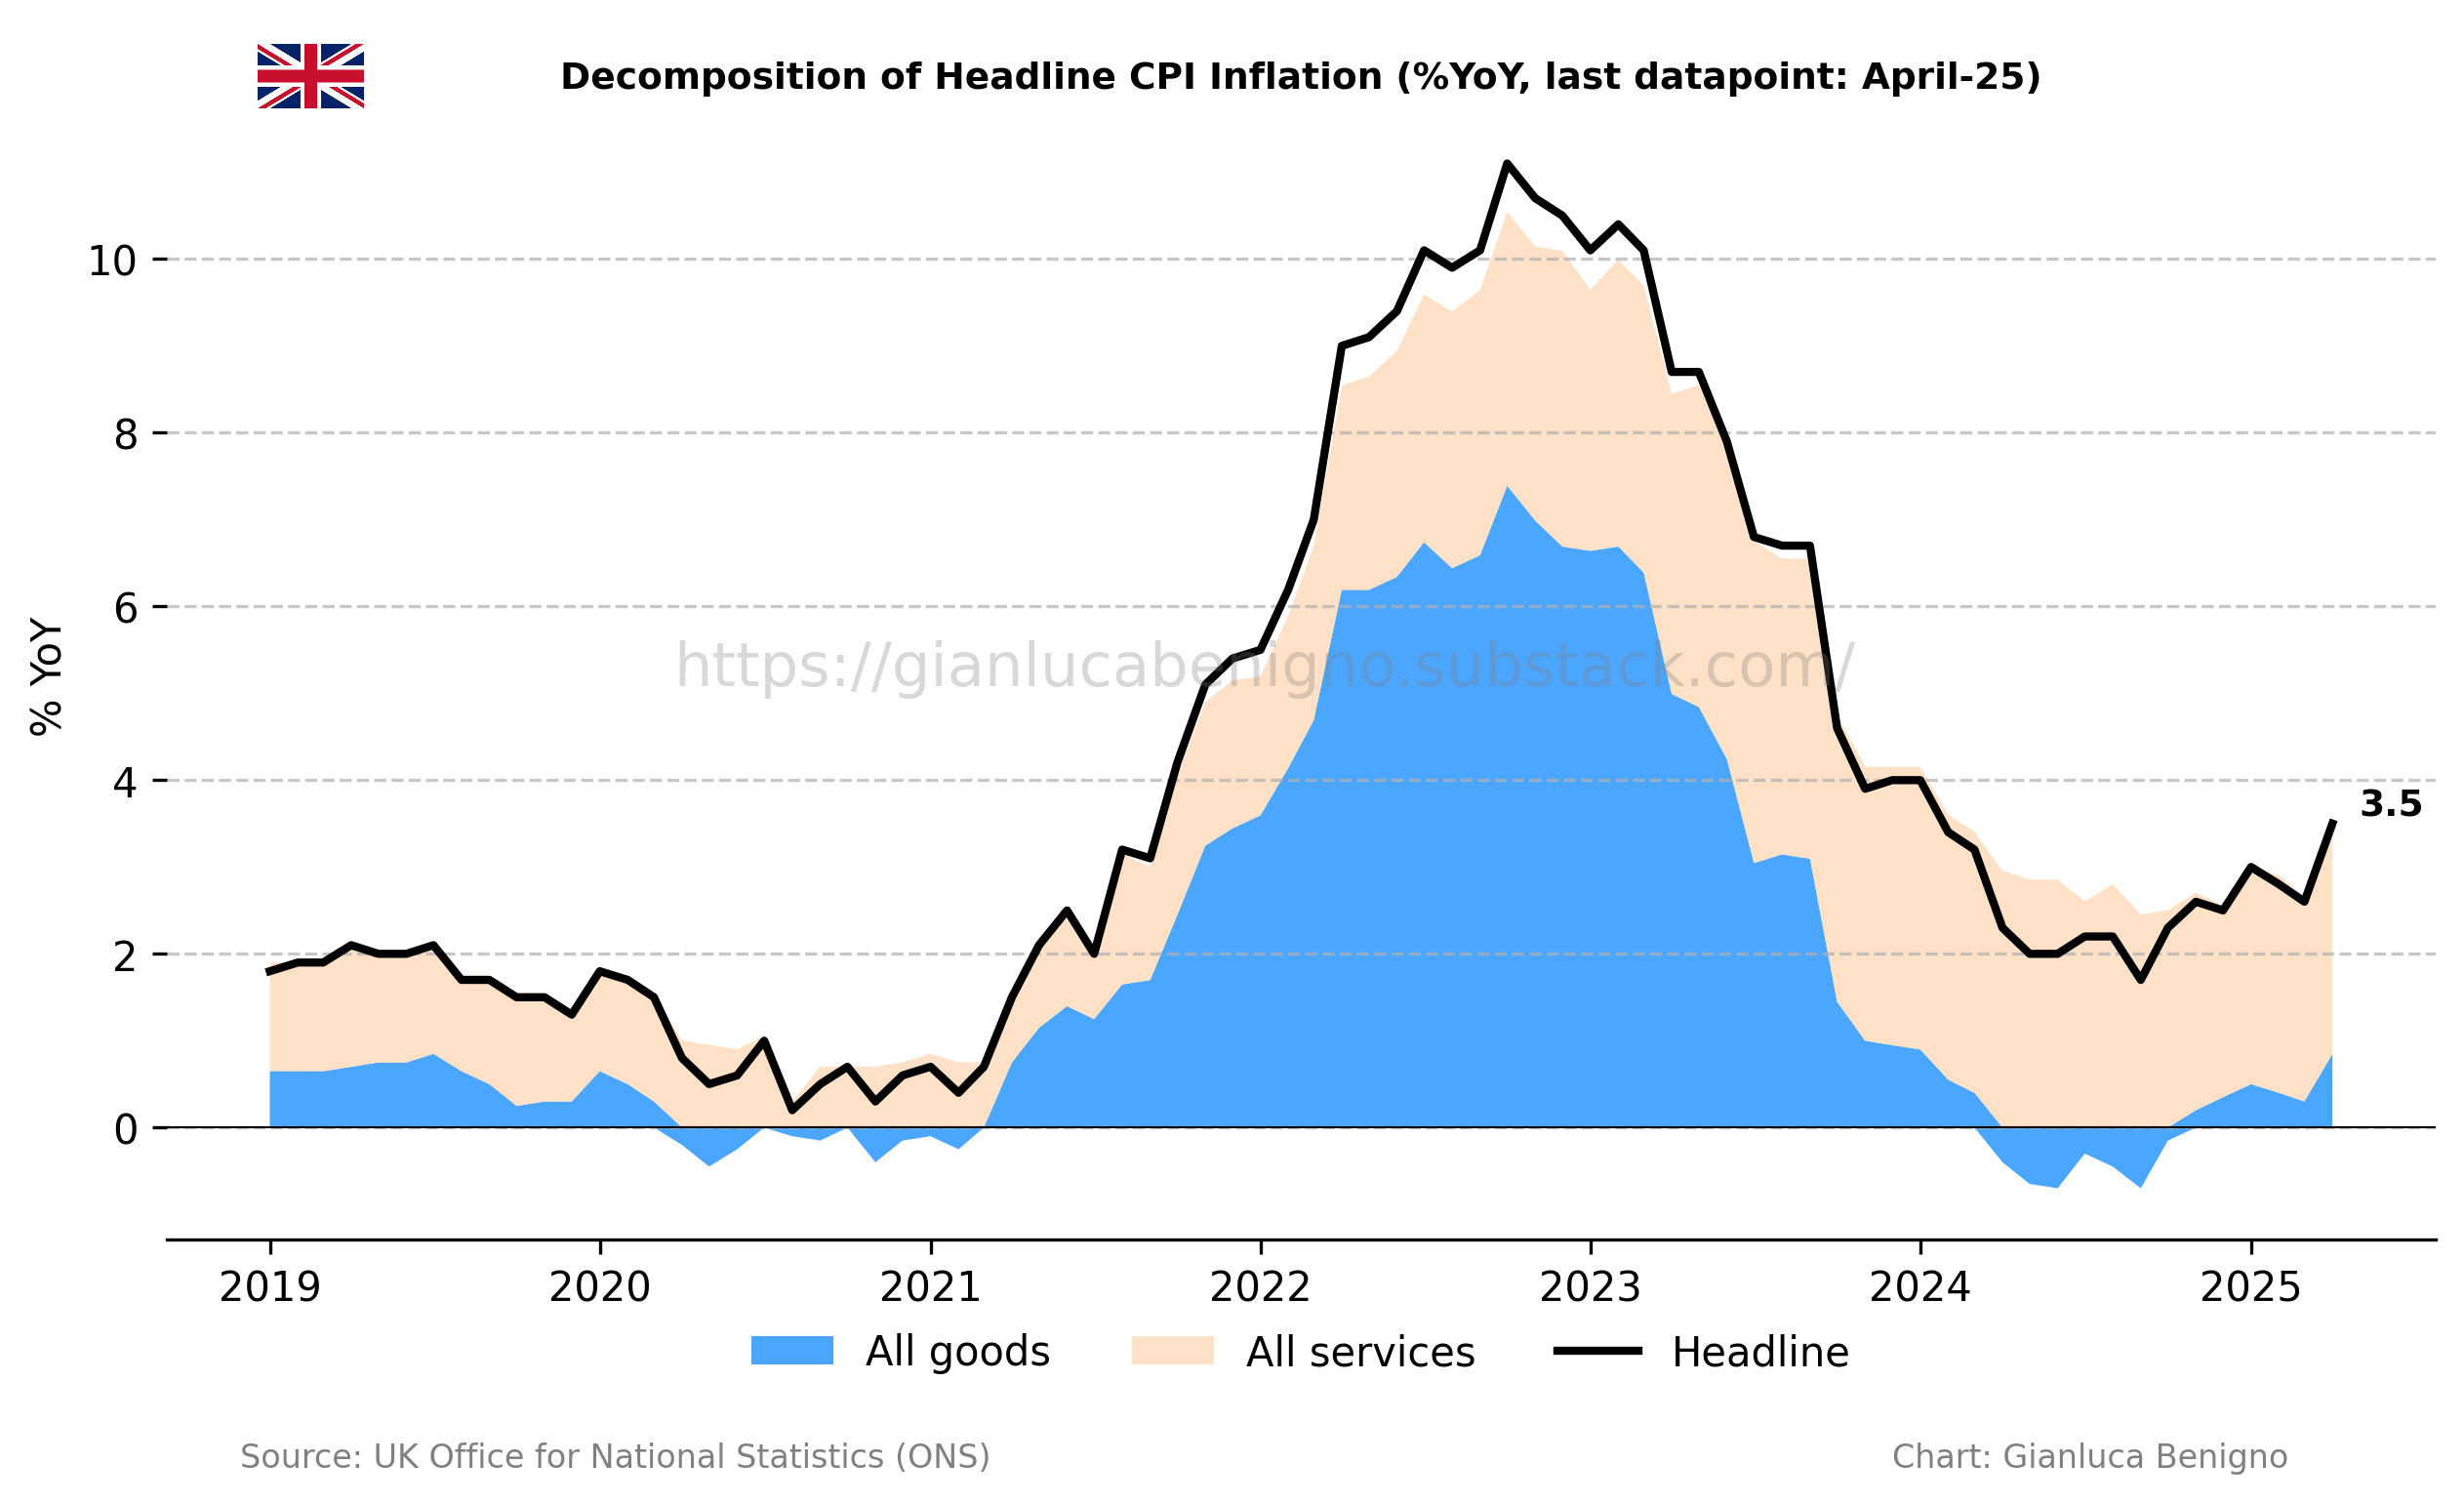
Consistent with the trend in other advanced economies, inflationary pressures remain primarily concentrated in the services sector, which saw an increase of 5.4% YoY in April, much higher than March’s 4.7% YoY increase. Meanwhile, inflation in the goods sector has been out of deflationary territory for the sixth consecutive month, rising 1.7% YoY in April, much higher than March’s increase of 0.6% YoY.
Elevated housing costs continue to be the primary driver of inflation within the services sector. In April, actual rents rose by 6.3% year-on-year, down from 7.2% in March, 7.4% in February, and 7.8% in January. This marks a meaningful deceleration and is consistent with expectations of further moderation, given the 100 basis point decline in interest rates since August 2024.
One notable increase in the current release is seen in the transport component, which rose by 3.3% year-on-year and 3.8% month-on-month. Within this category, transport services surged by 10.1% YoY and 8.6% MoM, driven primarily by air transportation, which spiked 16.2% YoY and 27.5% MoM. This sharp monthly rise reflects the timing of the index day, which coincided with the Easter holiday period, a time when airfares typically see a significant seasonal increase in the UK.
Our supercore service inflation (which removes actual rents for housing from services CPI) increased by 5.3% YoY in April, a steep rise compared to March’s 3.8% YoY increase.
Overall wages rose by 5.4% year-on-year in March, a slight moderation from the 5.6% YoY (non-seasonally adjusted) increase recorded in February. Our supercore wage measure, which approximates wage dynamics in the service sector, also eased, rising by 5.8% YoY in March compared to 6.4% in February.
The latest release, showing a surprising uptick in services inflation alongside still-elevated nominal wage growth, is likely to tilt the balance toward a more cautious stance by the Bank of England in its interest rate cutting cycle.
Related posts (with links)
UK March-25 CPI Inflation Report (previous release);
UK February-25 CPI Inflation Report (previous release);
UK January-25 CPI Inflation Report (previous release);
UK December-24 CPI Inflation Report (previous release);
The Flip Side of Monetary Policy (related post);
The Bank of England at a Crossroads: Rethinking the Narrative Before It’s Too Late? (related post);
Scenario Analysis as Communication Device for Central Banking (related post);
A Quasi-Global Inflation Overview (related post);
Has Wage Growth Fueled Inflation in the UK? (related post);
At the Core of UK Inflation (construction of supercore inflation and supercore wage index);
FT Alphaville on Catch-22 (short version of the Catch-22 effect);
Is the Bank of England in a Catch-22 Situation (long version of the Catch-22 effect);
Review of the Inflation Release

In April 2025, consumer prices increased by 3.5% year-on-year (YoY), higher than the market consensus of 3.3% and March’s figure of 2.6% YoY. On a month-on-month (MoM) basis, consumer prices increased by 1.2%, much higher than the 0.3% MoM increase recorded in March.
Core CPI, which excludes food and energy, rose by 3.8% YoY, above the consensus forecast of 3.6% YoY, and March’s 3.4% YoY increase (see Charts 1 and 2). On a month-on-month basis, core CPI increased by 1.4%, much higher than the 0.5% MoM increase recorded in March.
The services sector remains the primary driver of inflation, with an increase of 5.4% YoY in April, compared to 4.7% YoY in March. On a monthly basis, service inflation increased by 2.2% MoM, much higher than the 0.4% MoM increase observed in March. The goods sector inflation showed a 1.7% YoY increase in April, higher than the 0.6% increase observed in March. On a month-on-month basis, goods inflation increased by 0.3% MoM, the same rise as in March. Chart 3 highlights the persistence of service inflation and the recent uptick in goods price inflation, which is now adding to overall inflation rather than offsetting it, as it did for most of 2024.

A distinctive feature of inflation developments in the UK has been the ongoing rise in housing inflation (what we refer to as the “Catch-22” effect, see also “The Flip Side of UK Monetary Policy”), which has been the primary driver of inflationary pressures (Table 1). Actual rents for housing rose by 6.3% YoY in April, lower when compared to March’s 7.2% YoY increase and February’s 7.4% YoY increase, indicating now a clear declining path following the upward trend of actual rents for housing seen since September 2021. Given that interest rates peaked between August 2023 and August 2024, and following the logic of the Catch-22 effect, where higher rates initially fuel rent increases, it is reasonable to expect a continued decline in actual rent inflation through 2025. On a month-to-month basis, actual rents rose by 0.3% MoM in April, compared to 0.2% MoM in March and 0.3% MoM in February.

In this context, we’ve also updated our supercore wage index following the release of March’s nominal wage data (the data is released with a one-month lag) (Chart 5). As can be seen, there was an increase of 5.8% YoY in March, significantly below February’s 6.4% YoY increase. Overall wages have also increased by 5.4% YoY in March, slightly lower than the 5.6% YoY (n.s.a.) increase observed in February but still above the Bank of England’s comfort zone of 3.5-4% nominal growth.

Policy Implications
At its May 8th meeting, the Bank of England (BoE) reduced its policy rate by 25 basis points to 4.25%, marking a rare three-way split among Monetary Policy Committee members. Five members supported the 25bps cut, two preferred a more aggressive 50bps reduction, and two voted to keep rates unchanged. The decision reflected ongoing disinflation, particularly within the services sector, and expectations that wage growth will slow to no more than 4% by the end of 2025, based on a range of survey indicators.
The latest data release adds complexity to the Bank of England’s monetary policy outlook. Nominal wage inflation—both in aggregate and by our supercore measure—remains elevated. More notably, there has been a sharp increase in the services component of CPI inflation, a metric that has played a central role in the Bank’s scenario analysis of inflation dynamics. In light of this development, the Monetary Policy Committee is likely to adopt a more hawkish stance, favouring a prolonged pause in interest rates rather than the previously signalled path of gradual cuts at alternate meetings. Barring a strong resurgence in disinflationary pressures or clear signs of economic contraction, a more cautious policy posture from the Bank should be expected.
Table 1: CPI by components (% YoY)
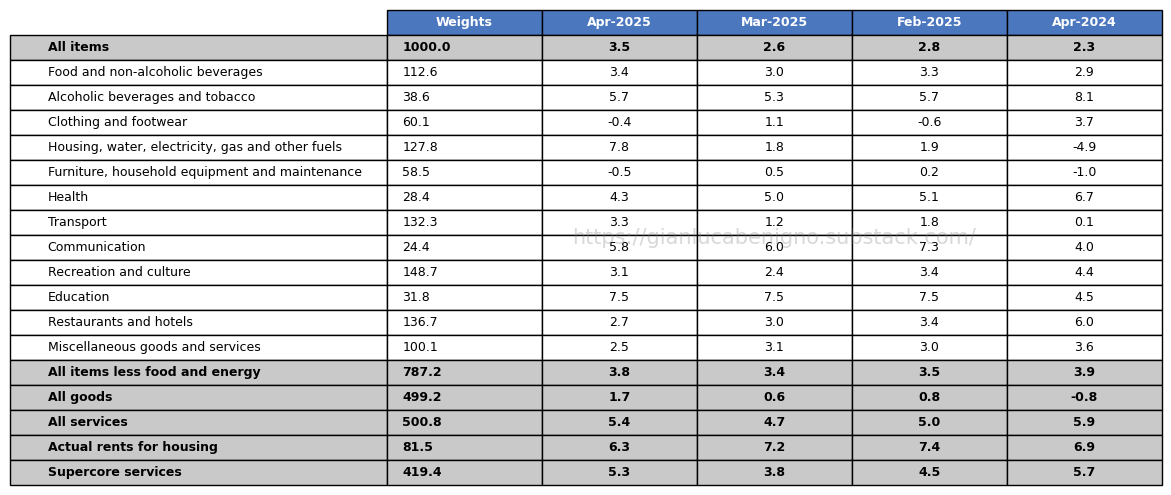
Source: UK Office of National Statistics (ONS)
Table 2: CPI by components (% MoM)

Source: UK Office of National Statistics (ONS).