


UK May-25 CPI Inflation Report
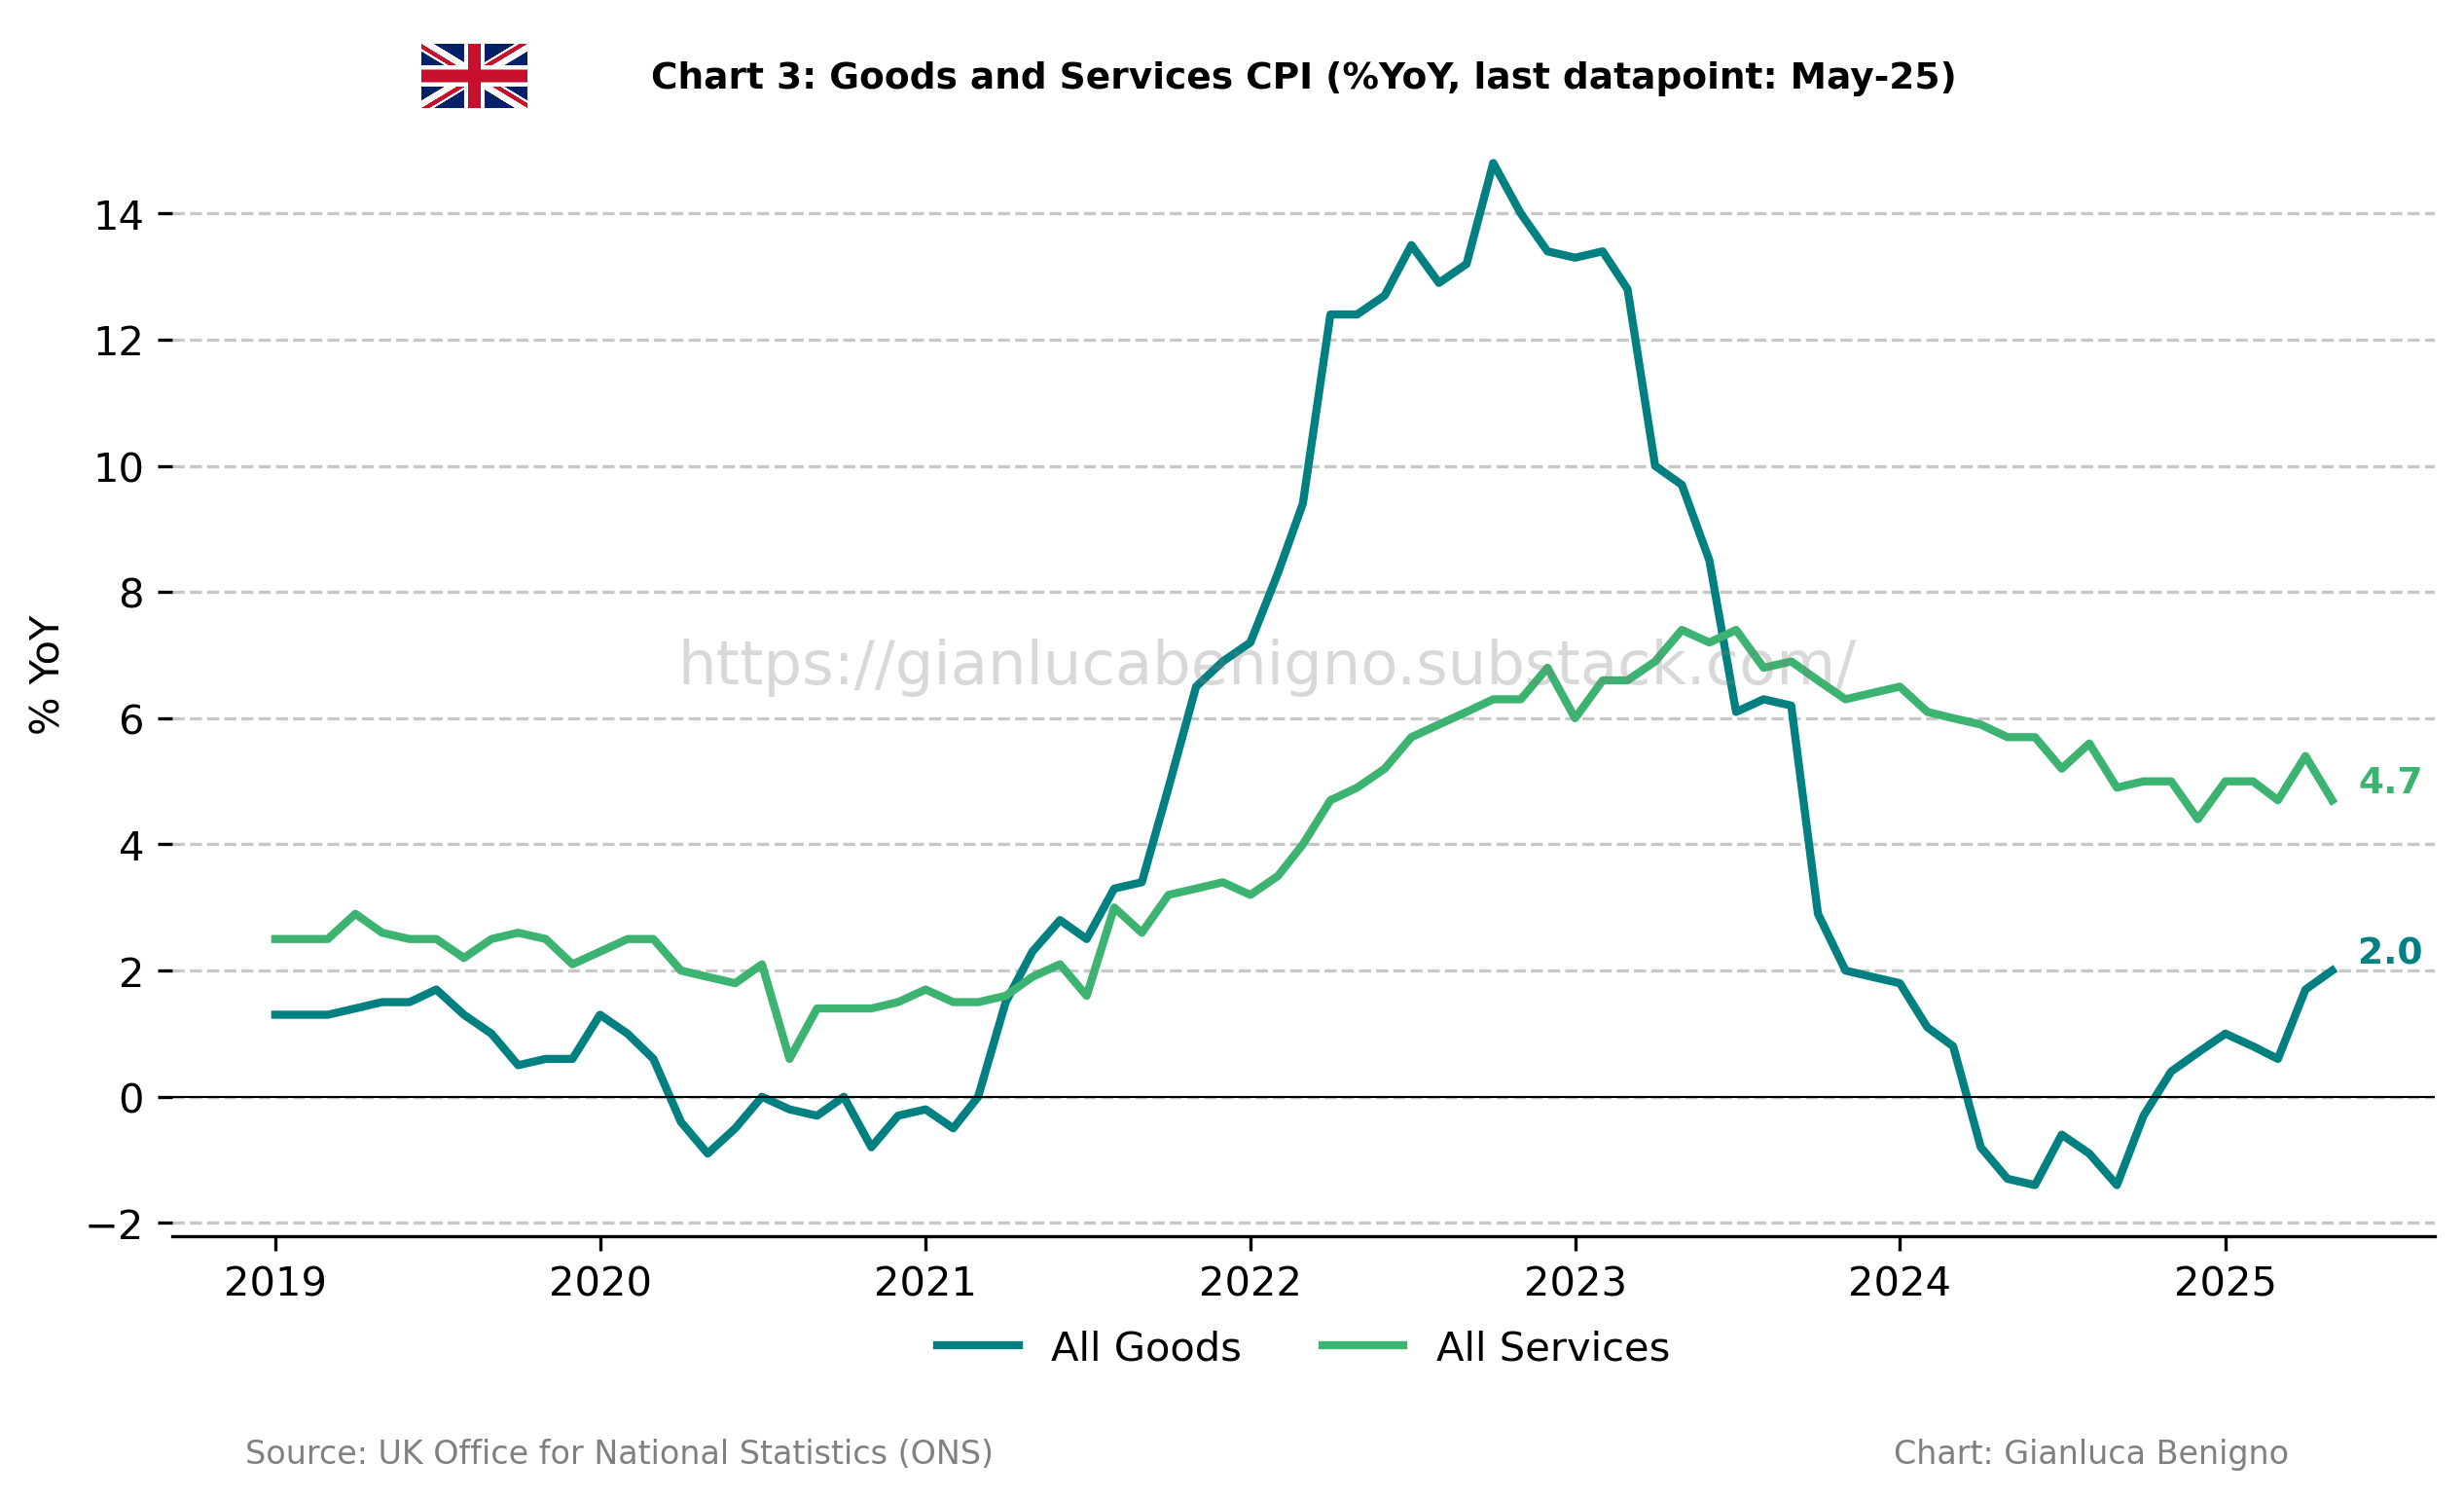
CPI broadly in line with both market expectations and the Bank of England’s projections. Notably, goods inflation has picked up, now reaching 2% year-on-year and continuing its upward trend.


Key takeaways:
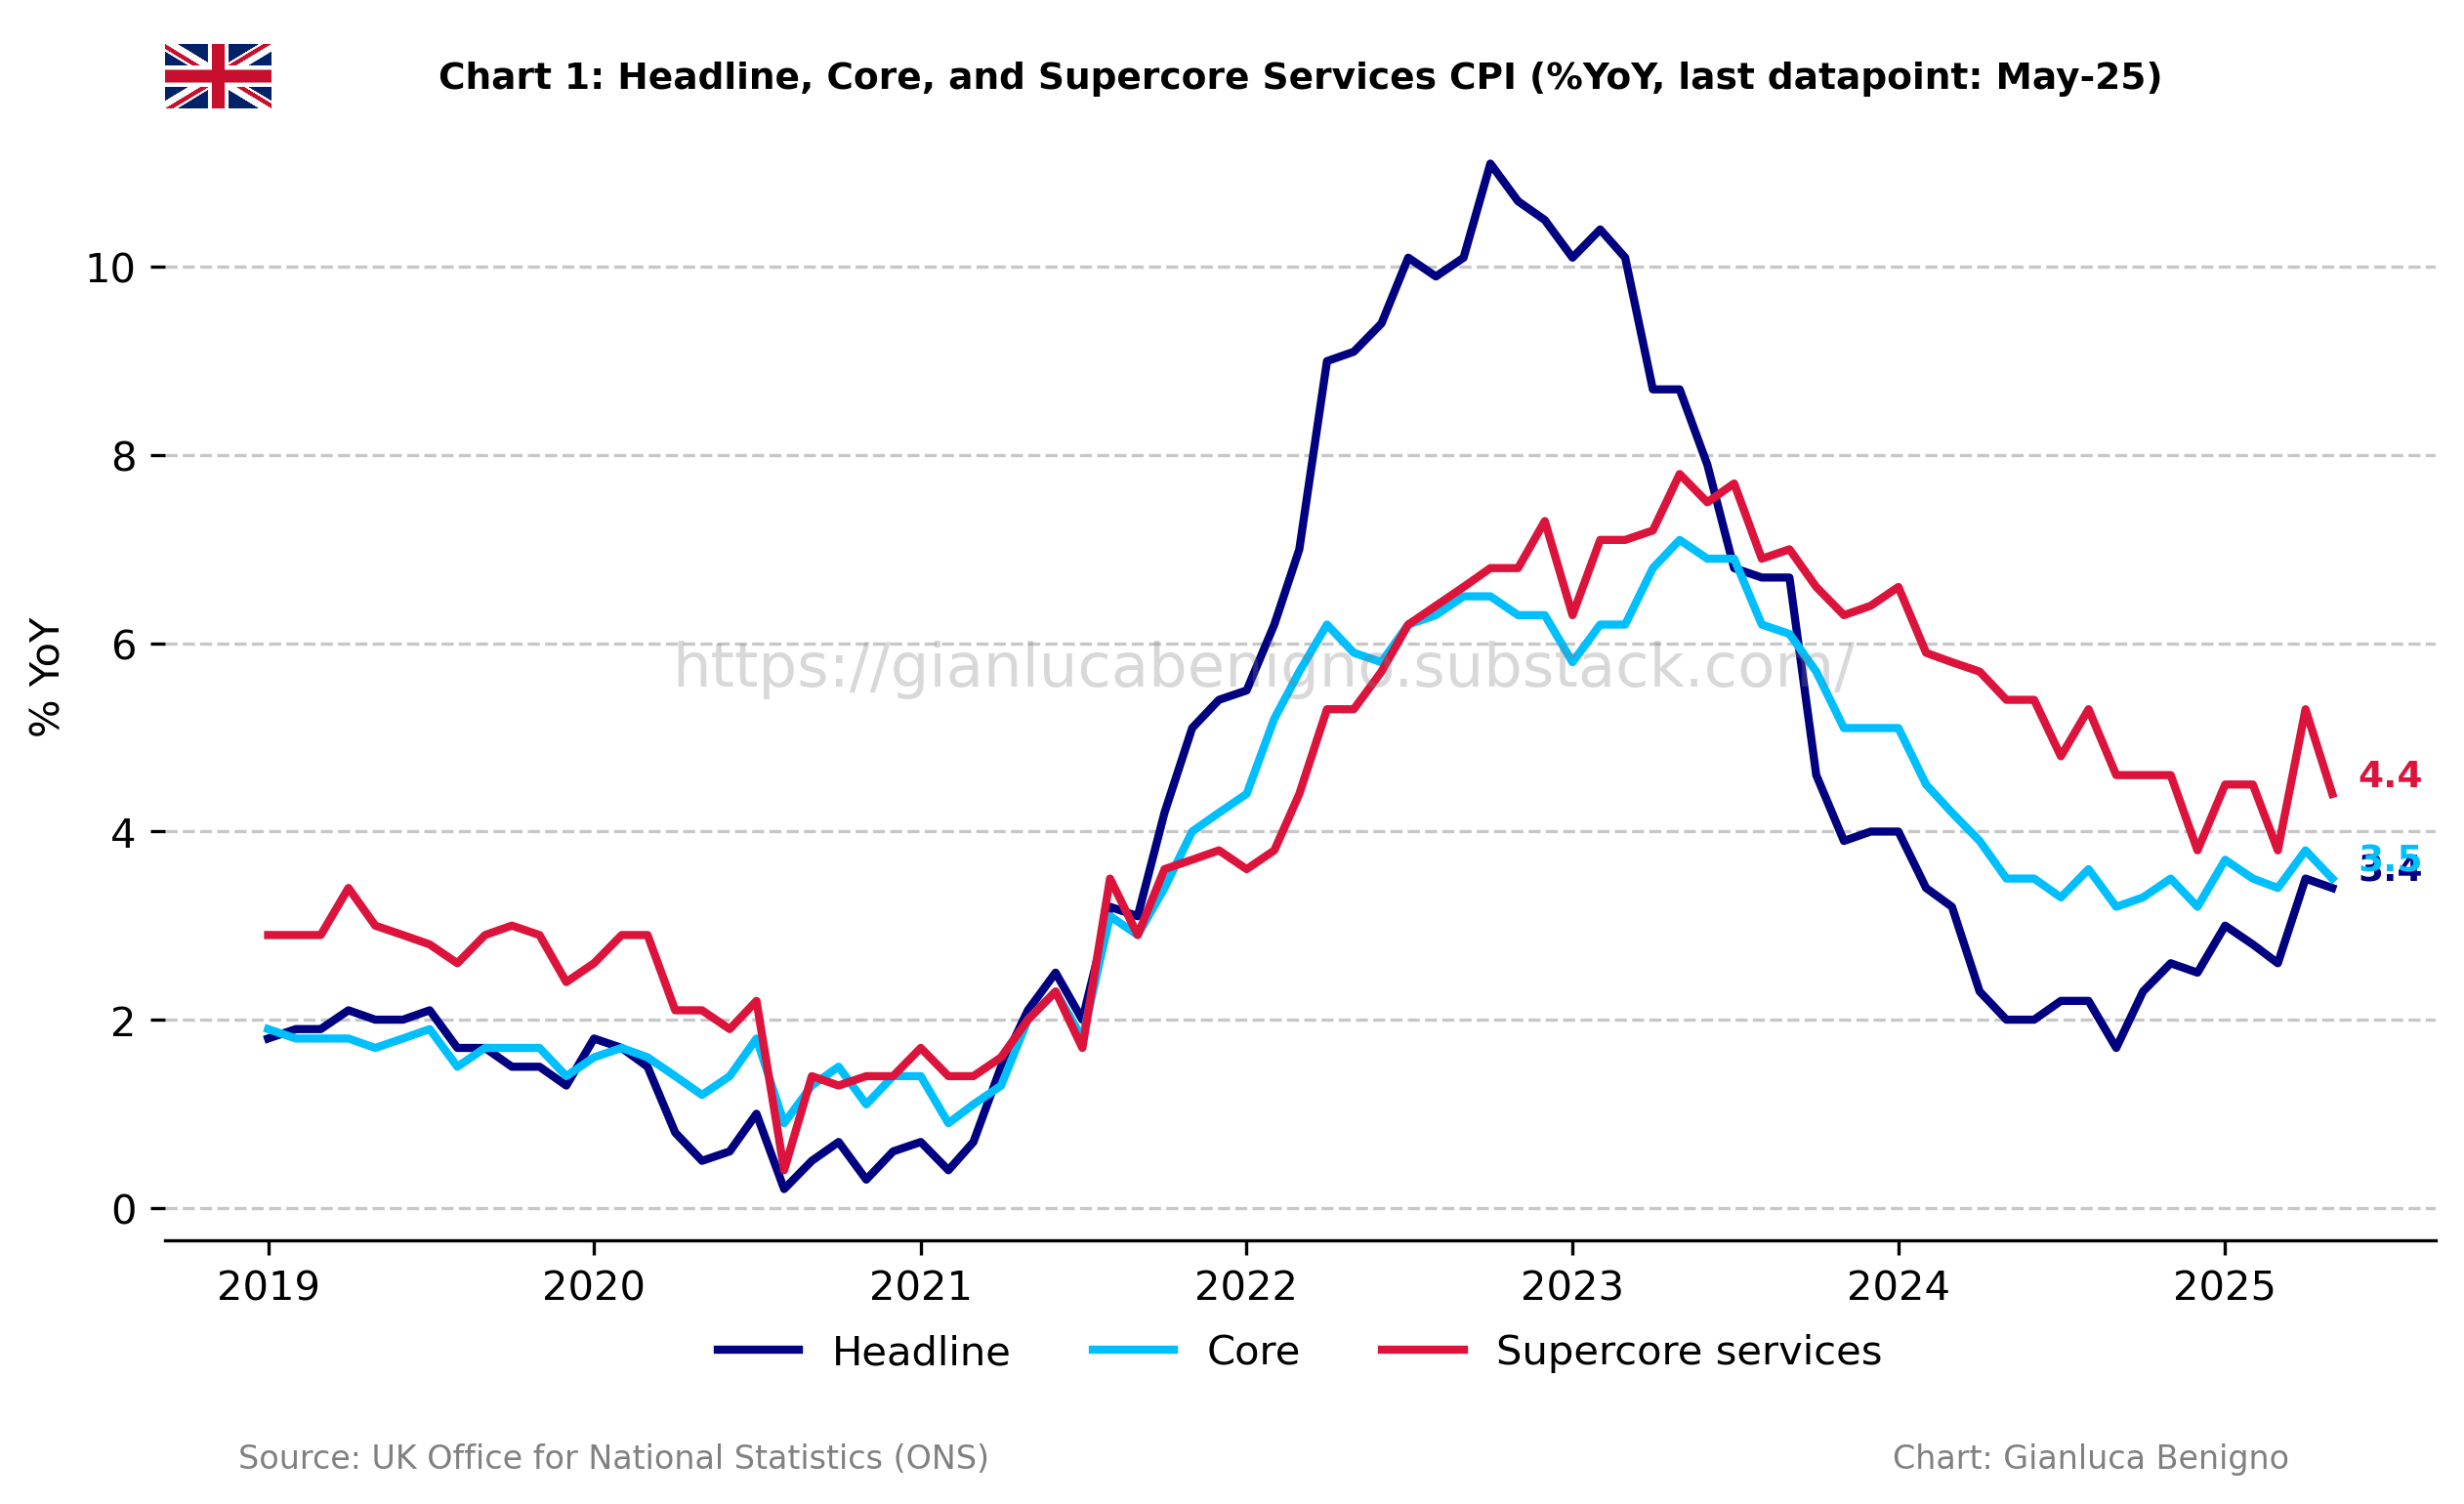
UK Consumer Price Index (CPI) increased by 3.4% year-on-year (YoY) in May, below April’s figure at 3.5% YoY, and in line with the market consensus of 3.4% YoY.
Core CPI in May increased by 3.5% YoY, below the consensus forecast of 3.6% YoY, and April’s figure of 3.8% YoY increase.
Consistent with the trend in other advanced economies, inflationary pressures remain primarily concentrated in the services sector, which saw an increase of 4.7% YoY in May, much lower than April’s 5.4% YoY increase. Meanwhile, inflation in the goods sector is now rising at 2.0% YoY, higher than April’s increase of 1.7% YoY.
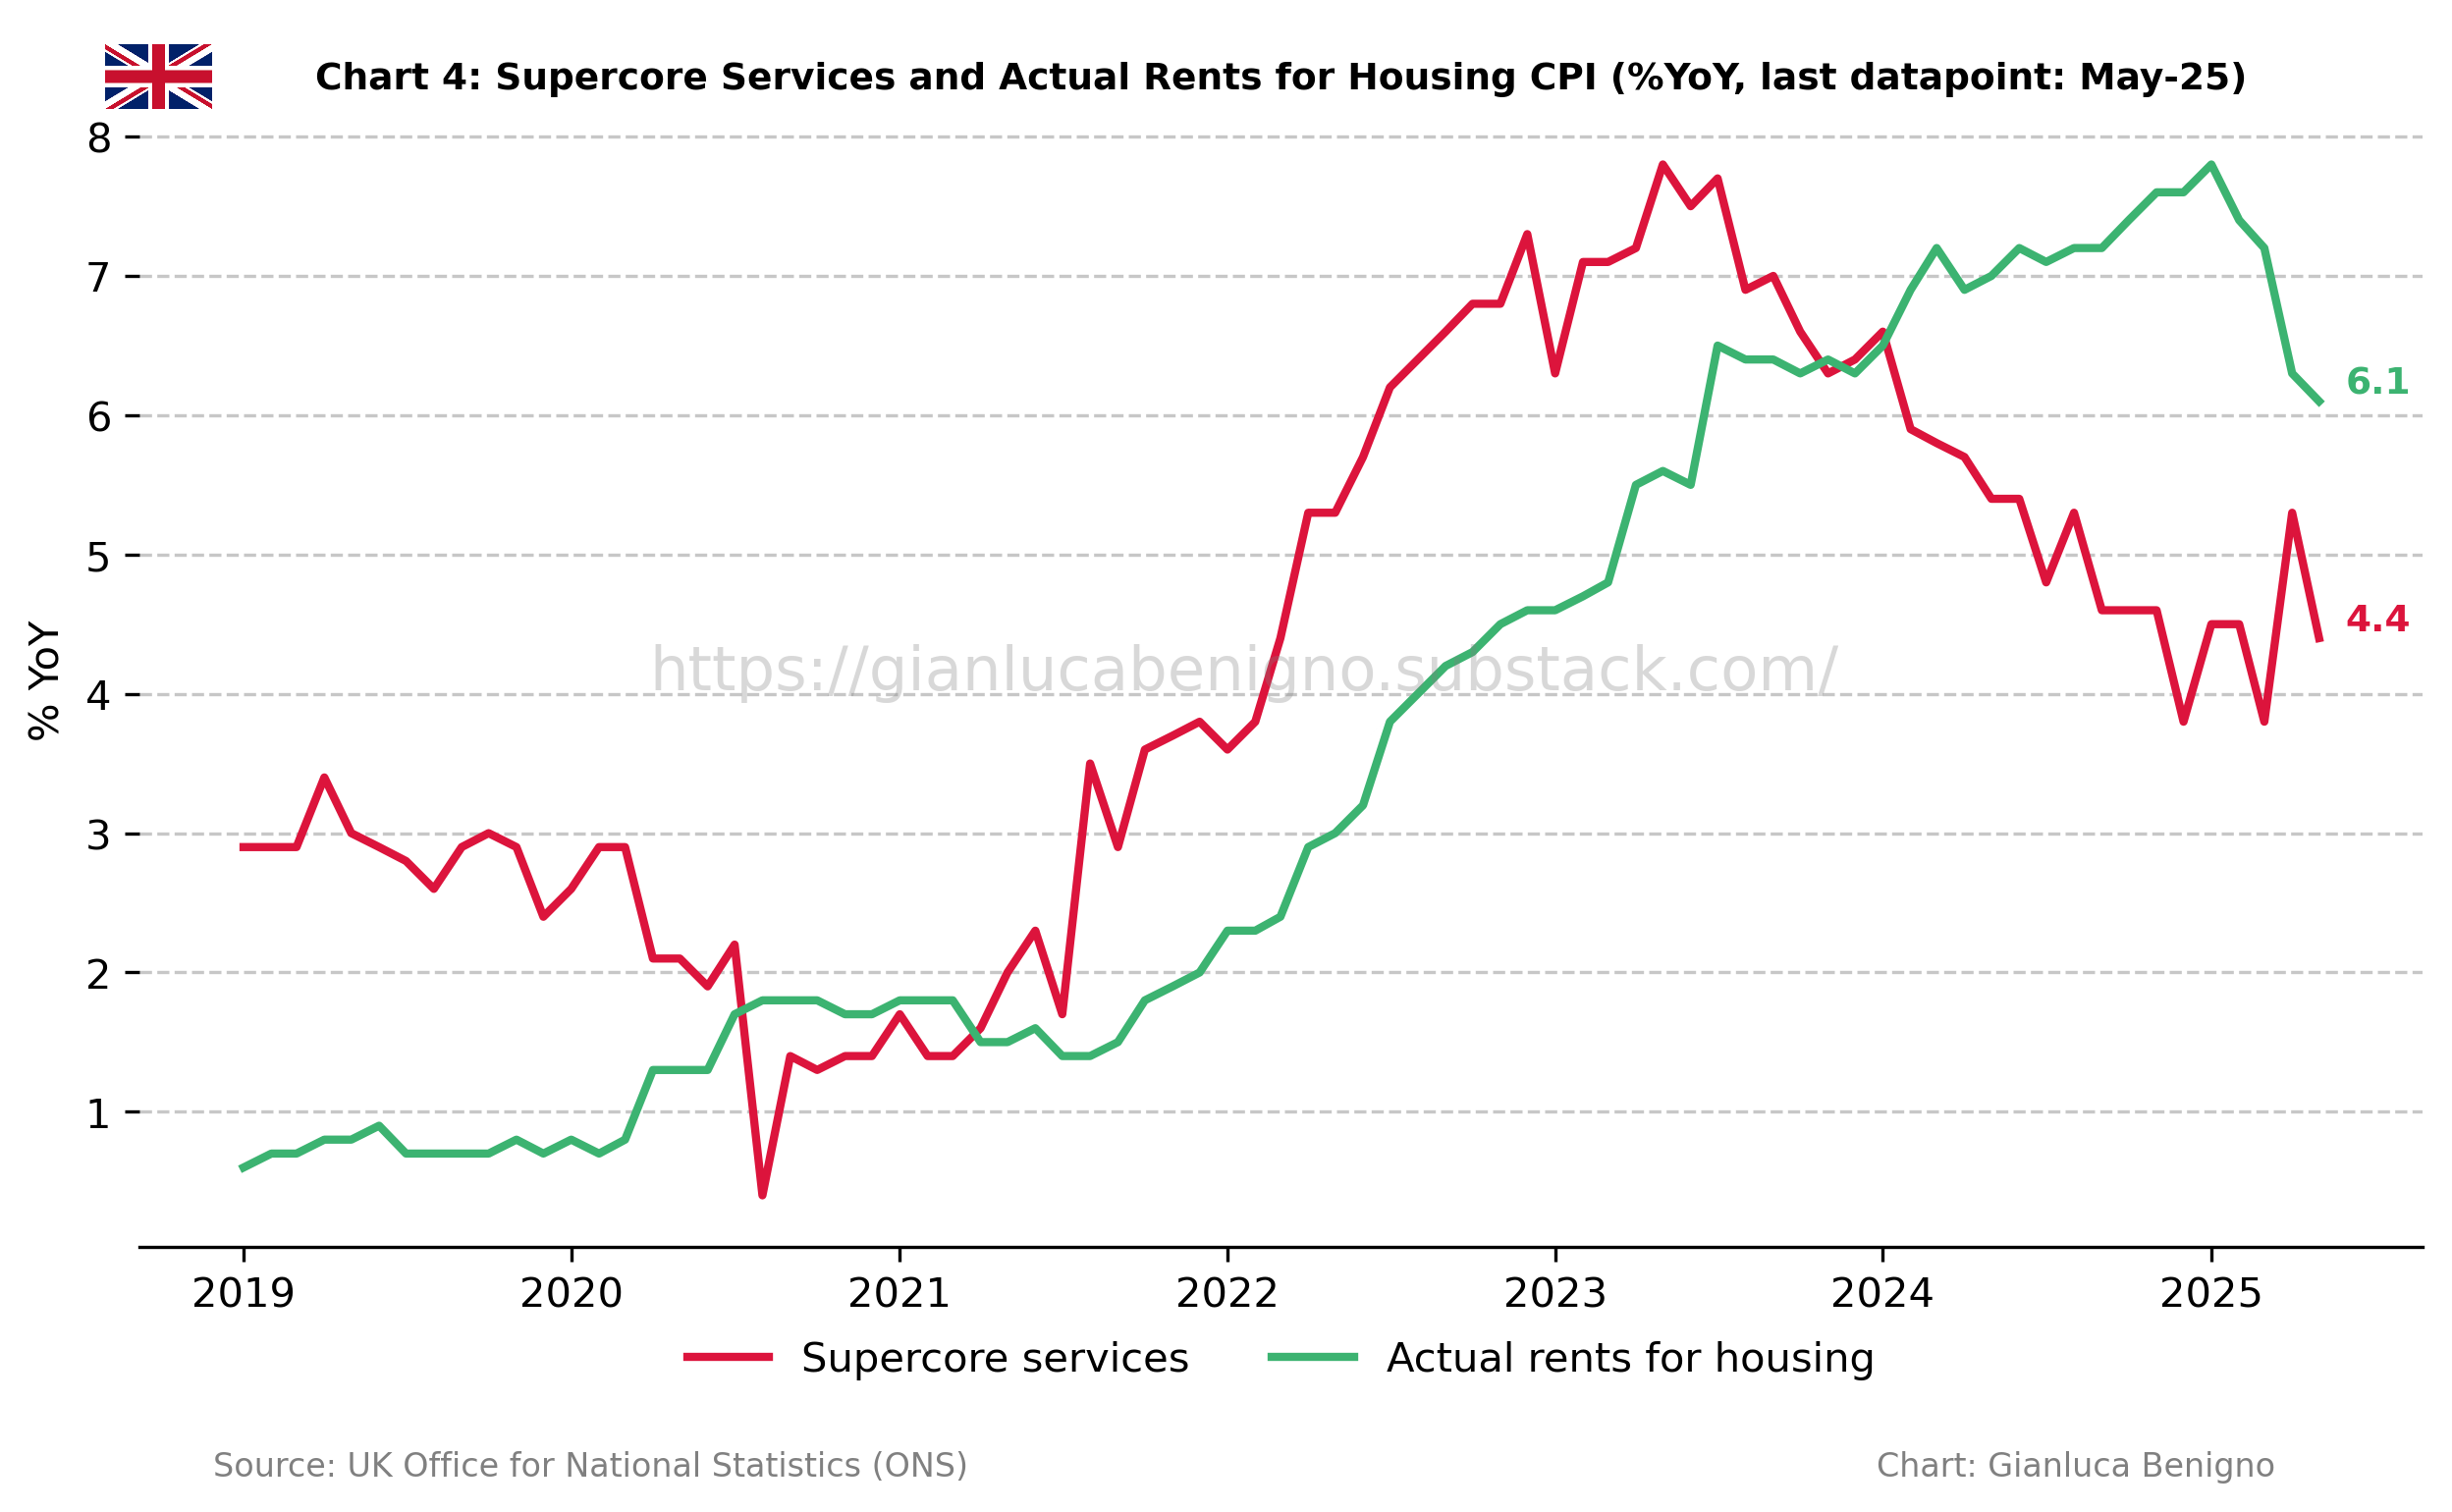
Elevated housing costs continue to be the primary driver of inflation within the services sector. In May, actual rents rose by 6.1% year-on-year, down from 6.3% in April. As noted in the previous report, the ongoing moderation in this component is to be expected, given earlier price increases and the decline in interest rates since August 2024.
Our supercore service inflation (which removes actual rents for housing from services CPI) increased by 4.4% YoY in May, much lower than April’s 5.3% YoY increase.
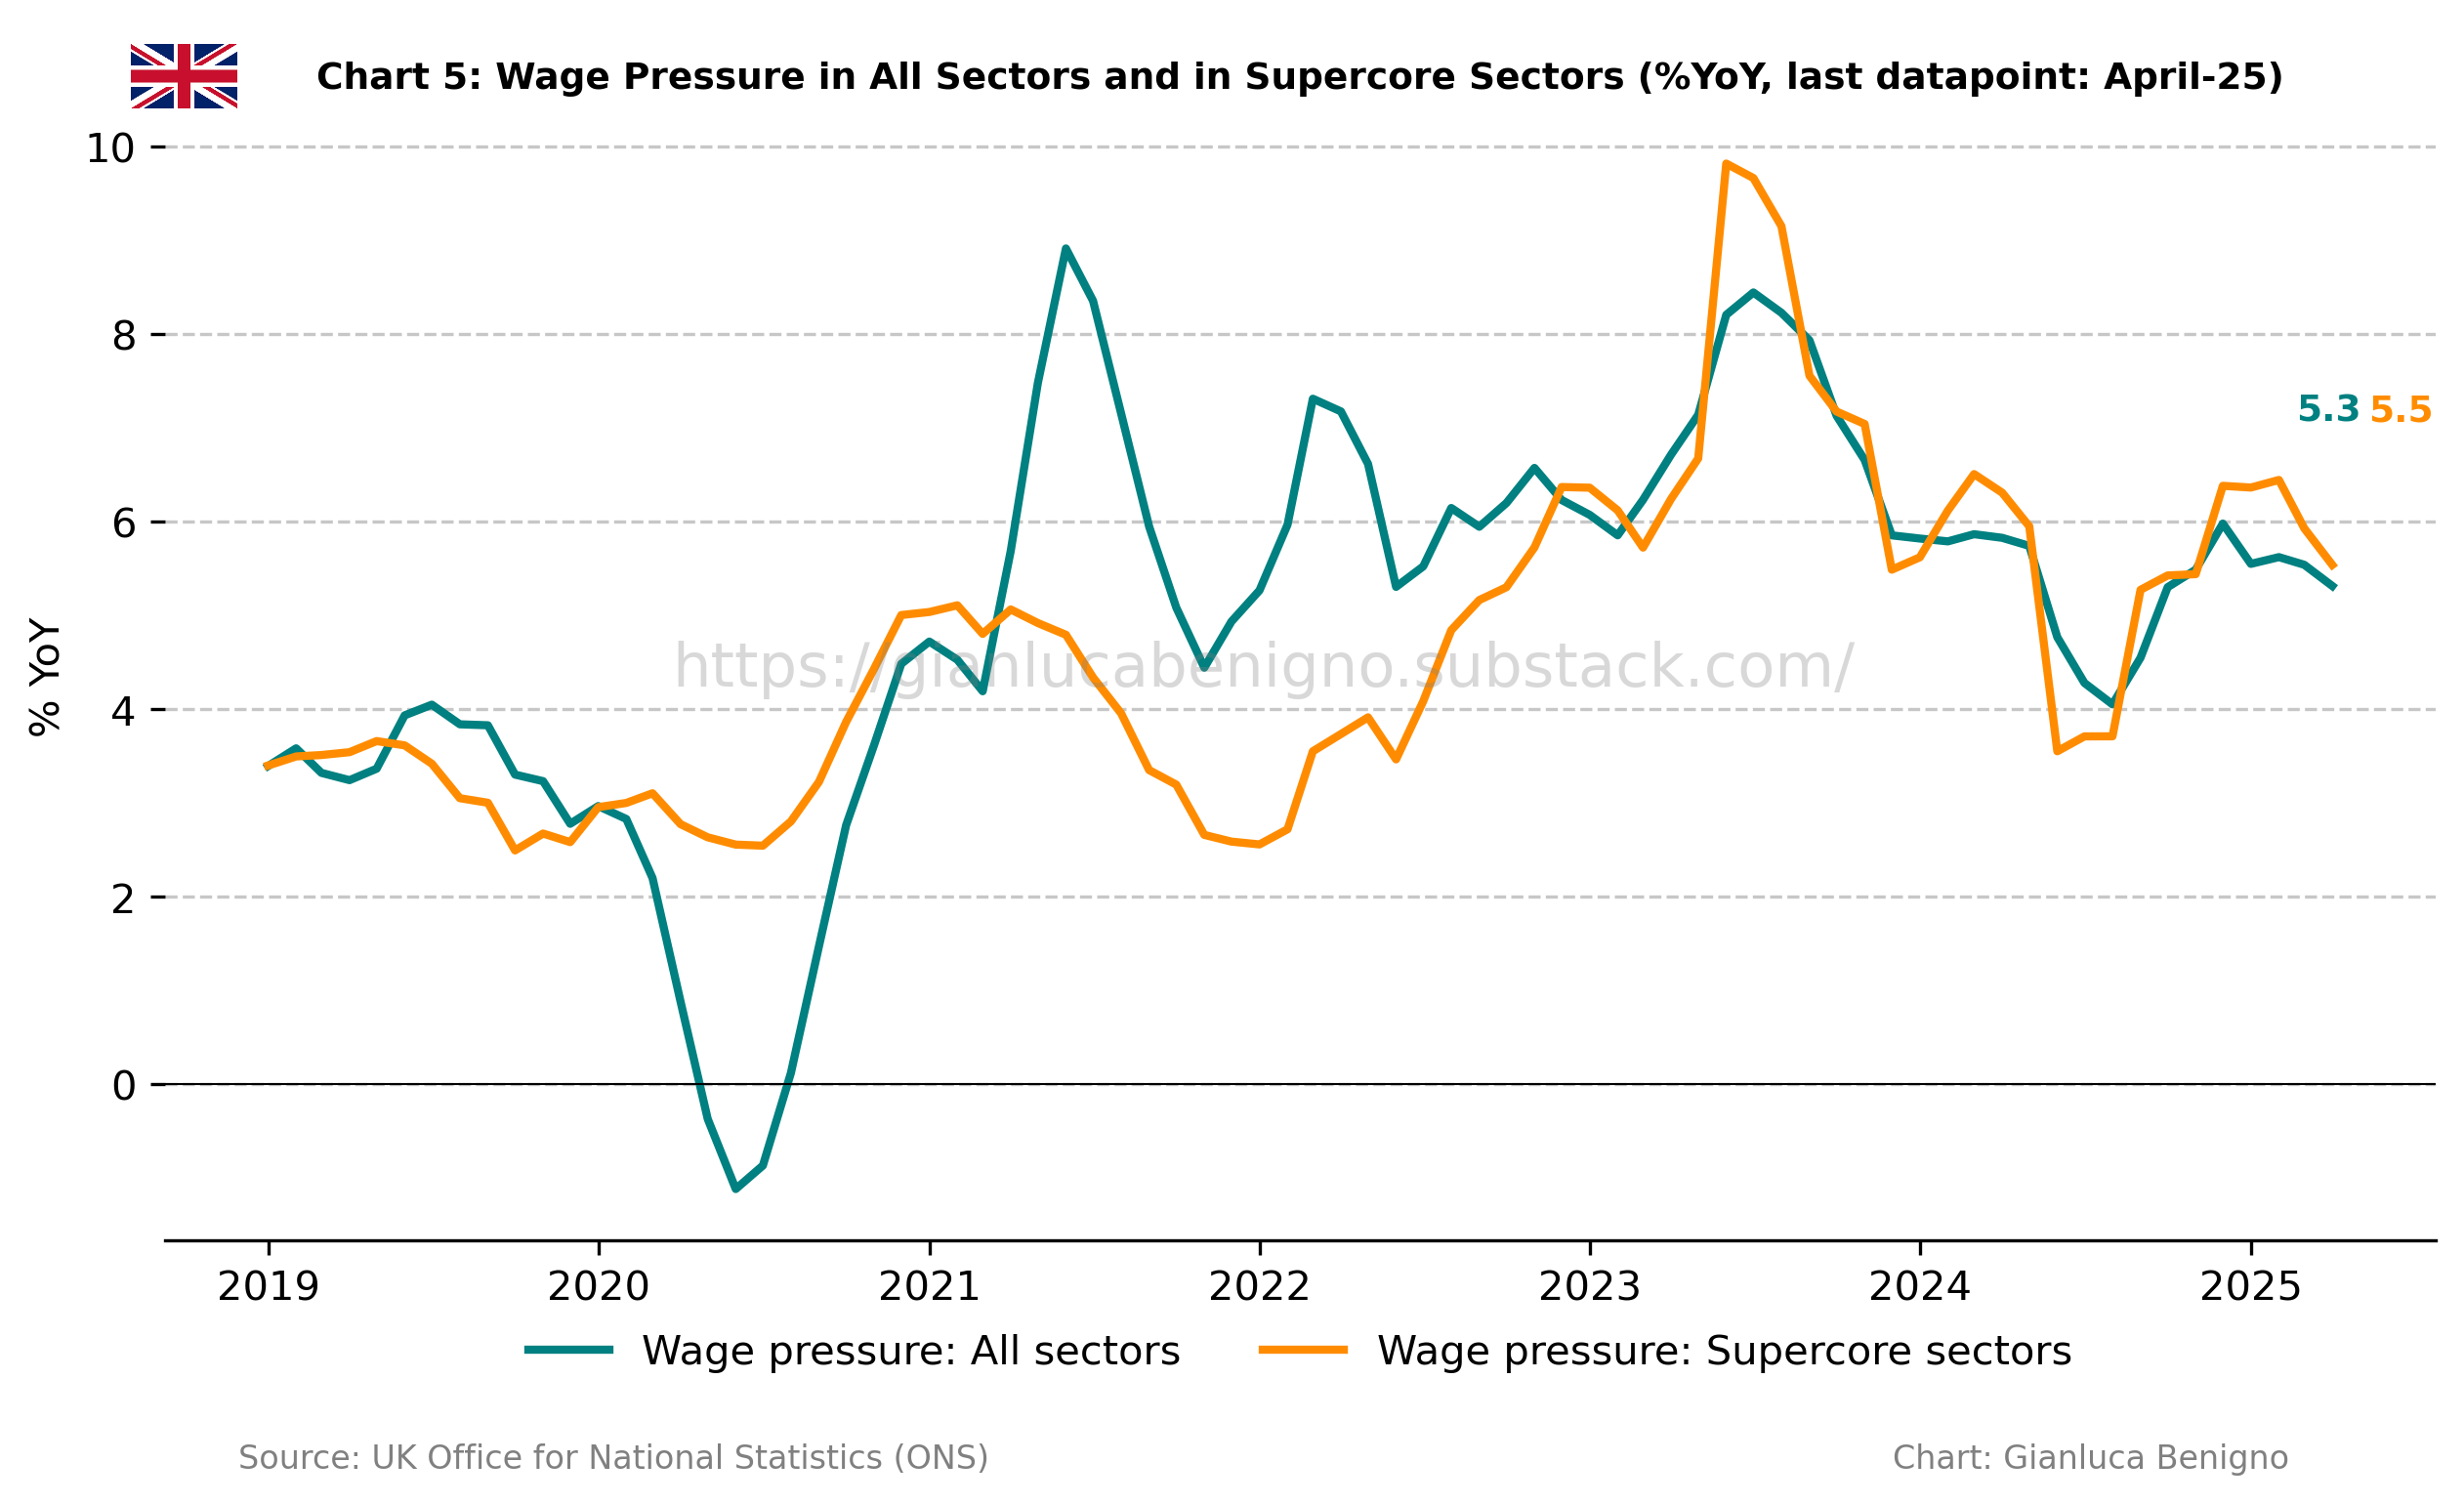
Overall wages rose by 5.3% year-on-year in May, a slight moderation from the 5.4% YoY (non-seasonally adjusted) increase recorded in April. Our supercore wage measure, which approximates wage dynamics in the service sector, rose by 5.5% in May compared to 5.8% in April.
Despite the high reading, the latest data show that service inflation has returned to a more moderate pace compared to last month, although nominal wage growth remains elevated and above the Bank of England’s comfort zone. Notably, goods inflation has been on an upward trend in recent months, now reaching 2% year-on-year.
While the Bank of England is expected to keep rates unchanged at tomorrow’s meeting, the August decision could prove more interesting, as one additional inflation report will be released beforehand. That report—together with wage data—will likely play a key role in shaping market expectations for the Bank’s ongoing easing cycle.
Related posts (with links)
UK April-25 CPI Inflation Report (previous release);
UK March-25 CPI Inflation Report (previous release);
UK February-25 CPI Inflation Report (previous release);
UK January-25 CPI Inflation Report (previous release);
UK December-24 CPI Inflation Report (previous release);
The Flip Side of Monetary Policy (related post);
The Bank of England at a Crossroads: Rethinking the Narrative Before It’s Too Late? (related post);
Scenario Analysis as Communication Device for Central Banking (related post);
A Quasi-Global Inflation Overview (related post);
Has Wage Growth Fueled Inflation in the UK? (related post);
At the Core of UK Inflation (construction of supercore inflation and supercore wage index);
FT Alphaville on Catch-22 (short version of the Catch-22 effect);
Is the Bank of England in a Catch-22 Situation? (long version of the Catch-22 effect);
Review of the Inflation Release
In May 2025, consumer prices increased by 3.4% year-on-year (YoY), in line with the market consensus of 3.4% and lower than April’s figure of 3.5% YoY. On a month-on-month (MoM) basis, consumer prices increased by 0.2%, much lower than the 1.2% MoM increase recorded in April.
Core CPI, which excludes food and energy, rose by 3.5% YoY, slightly below the consensus forecast of 3.6% YoY, and below April’s 3.8% YoY increase (see Charts 1 and 2). On a month-on-month basis, core CPI increased by 0.2%, much lower than the 1.4% MoM increase recorded in April.

The services sector remains the primary driver of inflation, with an increase of 4.7% YoY in May, compared to 5.4% YoY in April. On a monthly basis, service inflation decreased by 0.1% MoM, lower than the 2.2% MoM increase observed in April. The goods sector inflation showed a 2.0% YoY increase in May, higher than the 1.7% increase observed in April. On a month-on-month basis, goods inflation increased by 0.4% MoM, compared to the 0.3% MoM increase recorded in April. Chart 3 highlights the persistence of service inflation and the upward trend in goods price inflation, which is now adding to overall inflation rather than offsetting it, as it did for most of 2024.
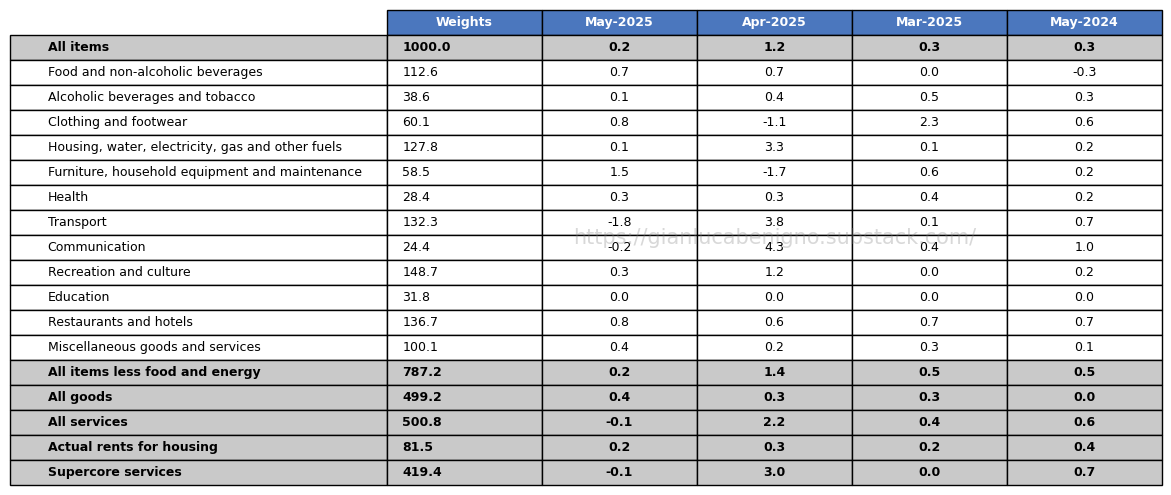
A distinctive feature of inflation developments in the UK has been the ongoing rise in housing inflation (what we refer to as the “Catch-22” effect, see also “The Flip Side of UK Monetary Policy”), which has been the primary driver of inflationary pressures (Table 1). Actual rents for housing rose by 6.1% YoY in May, lower when compared to April’s 6.3% YoY increase and March’s 7.2% YoY increase, indicating now a clear declining path following the upward trend of actual rents for housing seen since September 2021. Given that interest rates peaked between August 2023 and August 2024, and following the logic of the Catch-22 effect, where higher rates initially fuel rent increases, it is reasonable to expect a continued decline in actual rent inflation through 2025. On a month-to-month basis, actual rents rose by 0.2% MoM in May, compared to 0.3% MoM in April and 0.2% MoM in March.
In this context, we’ve also updated our supercore wage index following the release of April’s nominal wage data (the data is released with a one-month lag) (Chart 5). As can be seen, there was an increase of 5.5% YoY in April, significantly below March’s 5.8% YoY increase. Overall wages have also increased by 5.3% YoY in April, lower than the 5.4% YoY (n.s.a.) increase observed in March, but still above the Bank of England’s comfort zone of 3.5-4% nominal growth.
Policy Implications
The Bank of England will announce its decision on the Bank Rate tomorrow, June 19th, and markets widely expect the rate to remain unchanged at 4.25%. While little change is anticipated, the vote split among committee members will be of particular interest, though it's unlikely to produce the same level of surprise as the May 8th meeting, when a rare three-way split accompanied the rate cut.
That May decision was driven by ongoing disinflation, especially in the services sector, and by expectations—based on various surveys—that wage growth will slow to around 4% by the end of 2025.
Service inflation has moderated compared to last month, while nominal wage growth remains elevated. Both factors have played a significant role in shaping the scenario analysis that underpins the Bank of England’s policy narrative. Looking ahead to the August meeting, there is still one more set of CPI and wage data to come, which could prove decisive in guiding the Bank’s next steps.
Table 1: CPI by components (% YoY)

Source: UK Office of National Statistics (ONS)
Table 2: CPI by components (% MoM)
Source: UK Office of National Statistics (ONS).